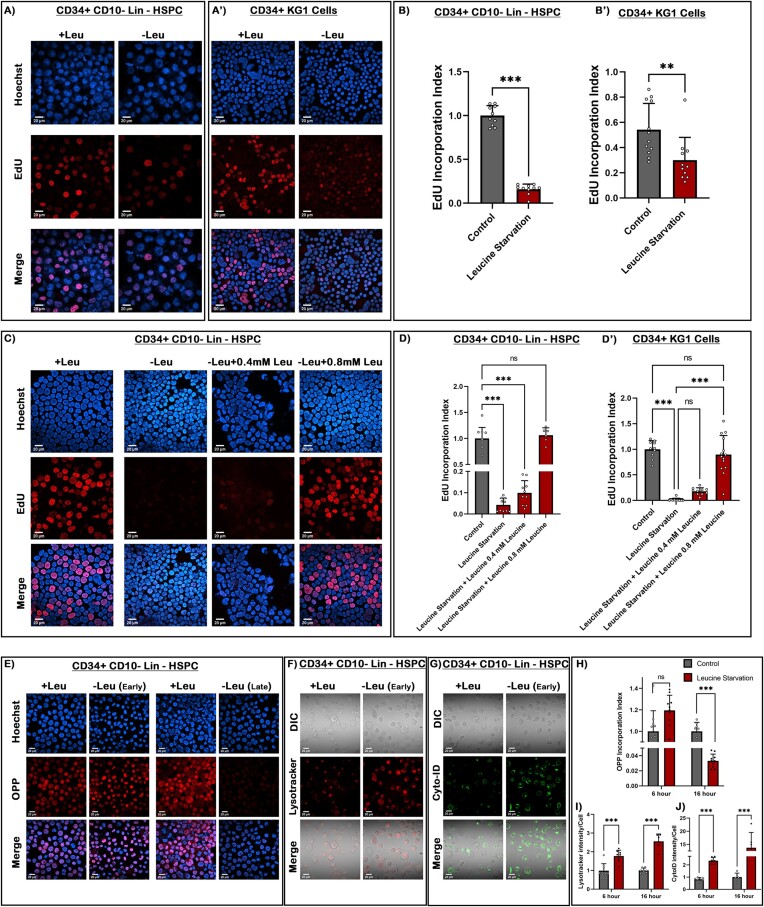
Figure 5.
Human blood progenitors exhibit leucine responsive proliferation similar to Drosophila. (A–A') EdU incorporation analysis of CD34+ CD10-Lin- myeloid biased HSPC in undeprived and leucine-deficient media. (B and B') Quantitative analysis in the proliferation rate of CD34+ CD10-Lin- HSPCs and KG1 cells. (C–D') Dose-dependent recovery in the proliferation rate of CD34+ CD10-Lin– HSPC upon increasing concentration of leucine in leucine deprived media. (D–D') Quantitative analysis of the recovery in proliferation index of CD34+ CD10-Lin- HSPCs and KG1 cells. (E) OPP incorporation rate analysis of CD34+ CD10-Lin-myeloid biased HSPC in early stages (6 h) of leucine deprivation versus late stages (16 h). (F) Lysotracker staining of acidic autolysosome upon leucine starvation at an early time point in HSPCs. (G) Cyto-ID staining of autophagosomes in response to leucine starvation at early time point in HSPCs. (H) Quantitative analysis of OPP incorporation rate at 6 and 16 h of leucine starvation condition in HSPCs. (I) Quantitative measurement of increased acidic vesicles (Lysotracker) in HSPCs. (J) Quantitative measurement of autophagosomes (Cyto-ID) in HSPCs. Scale, 20 μm in all images. Individual dots represent ‘n’ of the sample. Two-way ANOVA was performed for grouped analyses. One-way ANOVA was performed for individual multiple comparisons. Error bar: standard deviation (SD). Data are mean ± SD. *P< 0.033, **P< 0.002 and ***P< 0.001. See also Supplementary Figure S5.

