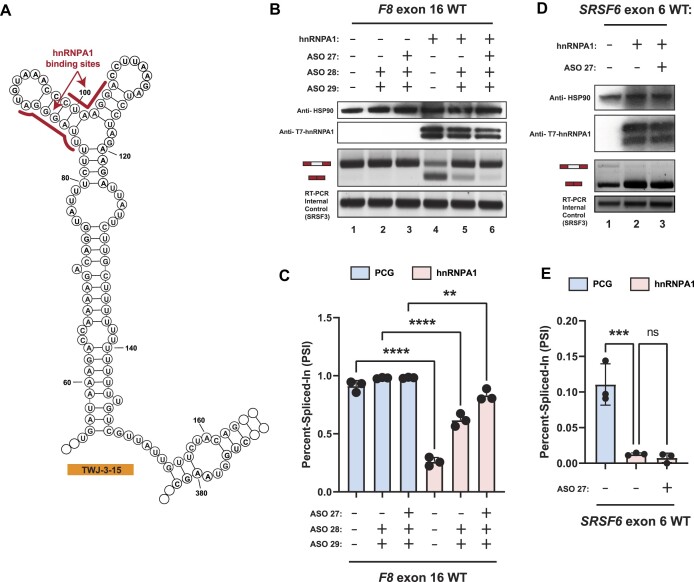
Figure 5.
hnRNPA1 cooperates with TWJ-3–15 to amplify inhibitory effects at the 3′ss of F8 exon-16. (A) Secondary structure model of TWJ-3–15 showing predicted hnRNPA1 binding motifs underscored in red. The sequence is numbered according to the nucleotide positions of the heterologous splicing reporter, from the 5′ to 3′ orientation. (B) Representative Western blot and agarose gel depicting results from our hnRNPA1-ASO competition assay. Upper two panels depict western blots for HSP90 and T7-epitope tagged hnRNPA1, respectively. Lower two panels depict the HBB splicing assay and the SRSF3 internal control for the RT-PCR reaction, respectively. Each condition tested in the assay is annotated as shown in the matrix above the gel. (C) A plot quantifying the results from (B) using the PSI ratio. Co-transfection of the WT exon-16 splicing reporter with either the empty expression vector (PCG) or the hnRNPA1 expression vector is indicated by a light blue or light red color, respectively. The same annotative matrix seen in (B) is used under the plot to label each ASO condition tested for each context. (D) Representative Western blot and agarose gel electrophoresis depicting results from our SRSF6 splicing assay. Each condition tested in the assay is annotated as shown in the matrix above the gel. (E) A plot quantifying the results from (D) using the PSI ratio. Co-transfection of the SRSF6 exon 6 splicing reporter with either the empty expression vector (PCG) or the hnRNPA1 expression vector is indicated by a light blue or light red color, respectively. The same annotative matrix seen in (D) is used under the plot to label each ASO condition tested for each context. Epitopes targeted by specific antibodies in the western blots are indicated to the left of their respective blots. Expected mRNA isoforms including or excluding the test exon are also annotated to the left of the agarose gel. Statistical significance between comparisons are denoted by asterisks that represent P-values with the following range of significance: ns, P> 0.05, **P≤ 0.01, ***P≤ 0.001, and ****P≤ 0.0001. Statistical significance was determined using analysis of variance (ANOVA), and Dunett's post-hoc test. Each exon-16 splicing reporter context and condition tested contains three independent/biological replicates.

