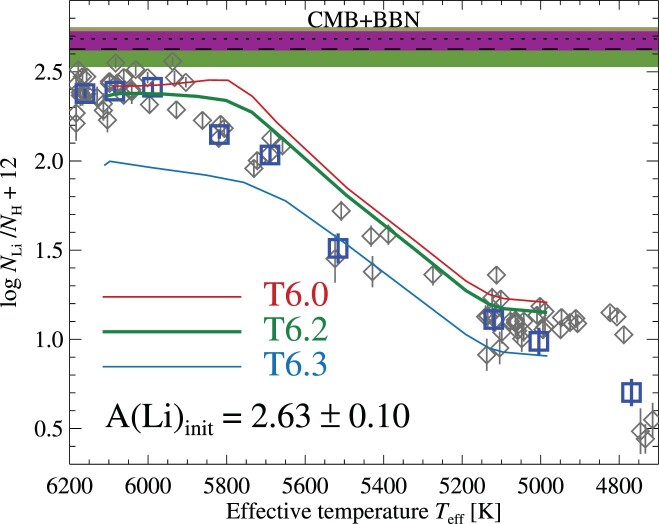
Figure 10.
Observed lithium abundances, compared to stellar evolution model predictions for different efficiencies of AddMix (see the text). Measurements for individual stars are shown as grey diamonds, while squares correspond to the Li abundances derived from co-added spectra. The initial, that is, diffusion-corrected, abundance of the models, A(Li) = 2.63 ± 0.10, shown by the horizontal dashed line and shaded region, compares well to the predicted primordial lithium abundance, A(Li) = 2.69, shown by the dotted horizontal line and shaded region.

