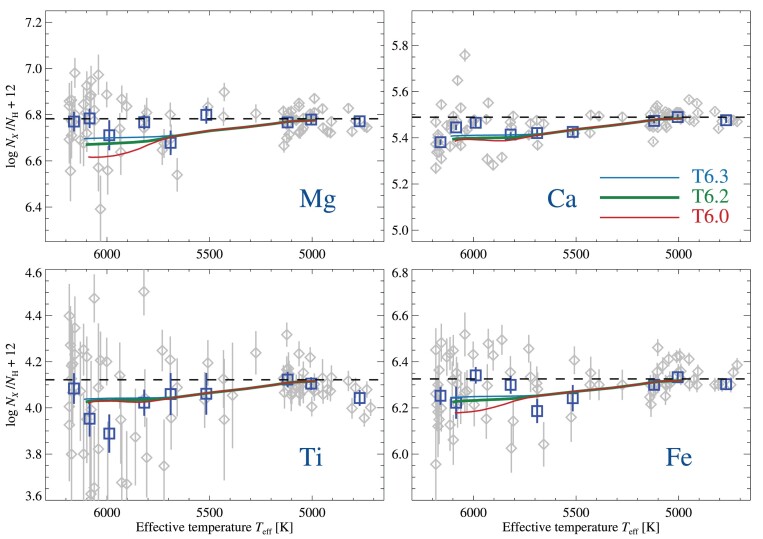
Figure 9.
Evolutionary abundance trends of Mg, Ca, Ti, and Fe. Mg abundances are derived from neutral lines, while Ti and Fe are derived from lines of singly ionized species, and Ca is based on a mixture of lines of both neutral and singly ionized species. The trends are compared to predictions from stellar structure models including AD with AddMix with different efficiencies, at an age of 12 Gyr. Horizontal, dashed lines represent the initial abundances of the models, which have been adjusted so that predictions match the observed abundance level of the coolest stars. Blue squares represent results for group-averaged co-added spectra, while grey diamonds represent results for individual stars.

