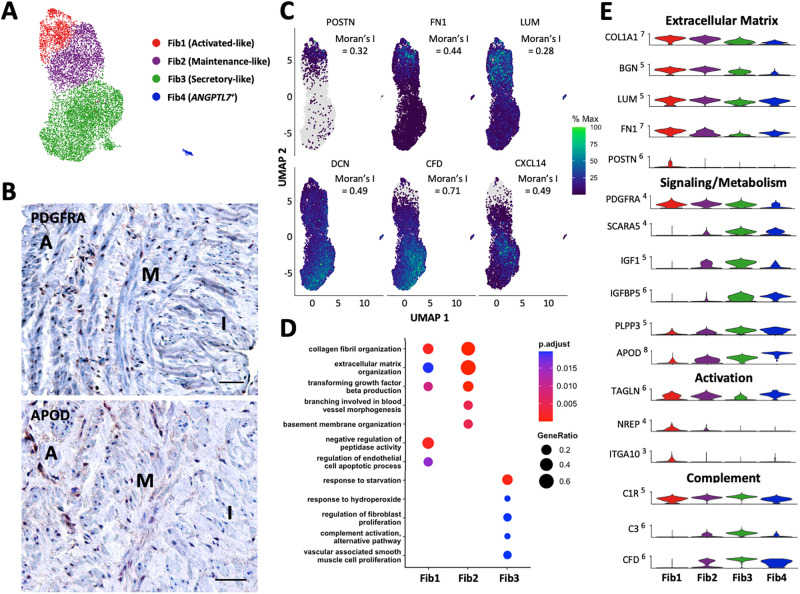
Fig 4. Fibroblasts in upper arm veins.
A) Focused UMAP of 9,172 fibroblasts isolated from upper arm veins. B) Localization of PDGFRA+ (pan-fibroblast marker) and APOD+ (secretory marker) fibroblasts by immunohistochemistry. Scale bars represent 50 μm. C) Feature plots indicating the relative expressions of fibroblast markers across a pseudotime defined by transcriptional similarities among cells. The Moran’s I statistics of spatial autocorrelation is shown for each gene. D) Gene ontology pathways unique and in common among the 3 main fibroblast subtypes. E) Violin plot representation of expression differences among fibroblast populations.

