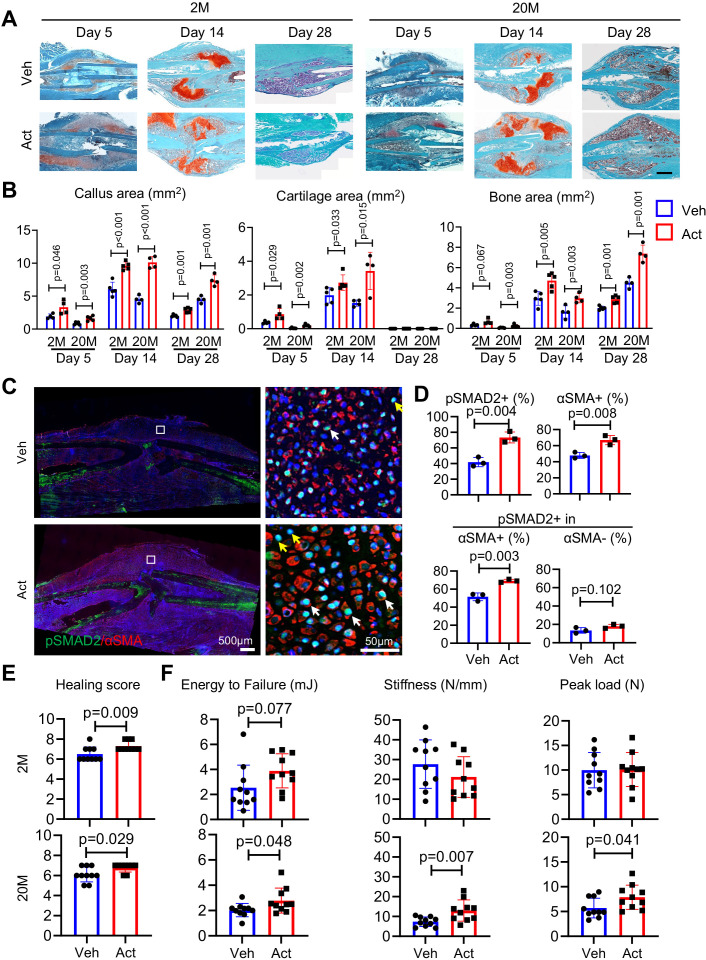
Figure 6. Local Activin A implantation promotes fracture healing.
(A) Representative Safranin O/Fast green staining histochemical images of fracture calluses at days 5, 14, and 28 post fracture. Two-month-old (2M) or 20-month-old (20M) mice were implanted with a 50-μl Matrigel aliquot containing vehicle (Veh) or Activin A (ACT) (1 μg) at the fracture site immediately after surgery. Scale bar, 1 mm. (B) Callus area, cartilage area, and bone area were quantified at indicated time points. n = 4 mice/group. (C) Immunofluorescence images of pSMAD2 and αSMA in fracture calluses of control and ACT-implanted mice at day 5 post fracture. White arrows point to pSMAD2+αSMA+ cells and yellow arrows point to pSMAD2+αSMA− cells. Scale bar, 500 μm (low mag), 50 μm (high mag). (D) Percentage of pSMAD2+, αSMA+ cells in fracture calluses and pSMAD2+ cells within αSMA+/− populations were quantified. n = 3 mice/group. (E) Fracture healing scores were quantified in bones of 2- and 20-month-old mice at 6 weeks post fracture. n = 10 mice/group. (F) Mechanical testing was performed on bones of 2- and 20-month-old mice at 6 weeks post fracture. n = 10 mice/group. Data are expressed as means ± SD and analyzed by unpaired two-tailed t-test.


