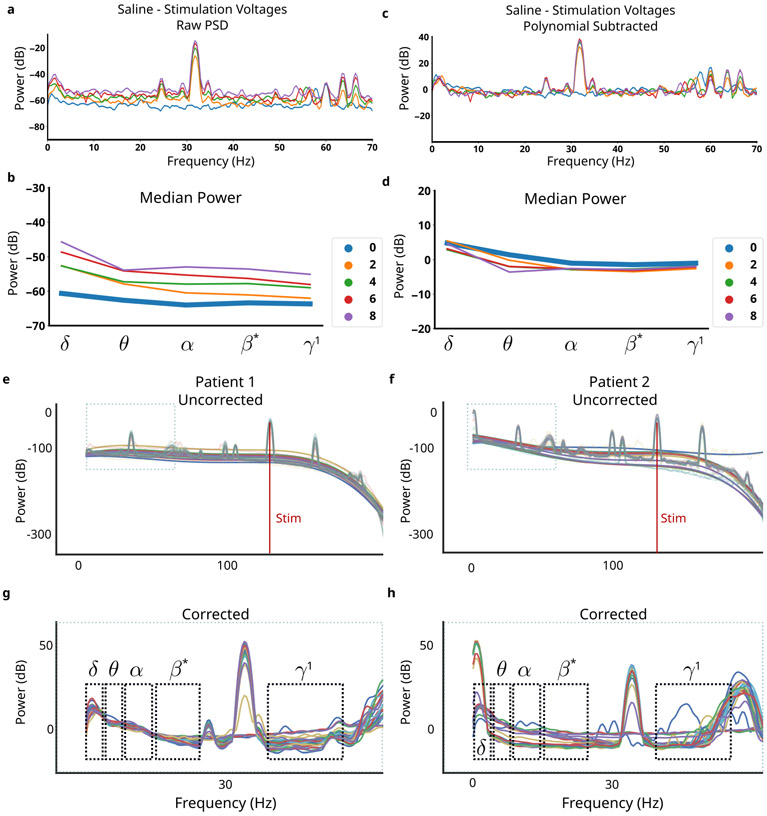
Fig. 7. Applied MC Mitigations.
a, Raw PSDs recorded in agar at stimulation voltages between 0V to 8V. b, Oscillatory power calculated in each band for each tested stimulation voltage. c, Corrected PSDs remove features that are corrupted by mismatch compression. d, Oscillatory power calculated converges to the no-stimulation condition across all stimulation voltages. e,f, PSDs from chronic recordings across 7 months in two patients. Thin lines are weekly averaged PSDs, bold lines are polynomial fits to highlight weekly variability. g,h, MC pipeline applied to all weekly PSDs shows removal of features distorted by MC. Significant inter-patient variability is observed; differences in oscillatory power can more confidently be ascribed to neural sources.

