. 2023 Dec 1;4(6):1136–1144. doi: 10.37349/etat.2023.00187
© The Author(s) 2023.
This is an Open Access article licensed under a Creative Commons Attribution 4.0 International License (https://creativecommons.org/licenses/by/4.0/), which permits unrestricted use, sharing, adaptation, distribution and reproduction in any medium or format, for any purpose, even commercially, as long as you give appropriate credit to the original author(s) and the source, provide a link to the Creative Commons license, and indicate if changes were made.
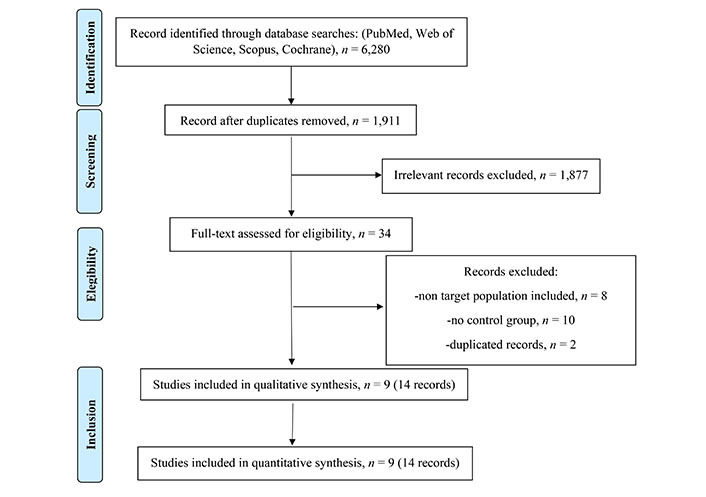
Figure 1.

Flow diagram documents the total number of screened, selected, and excluded studies
