FIGURE 2.

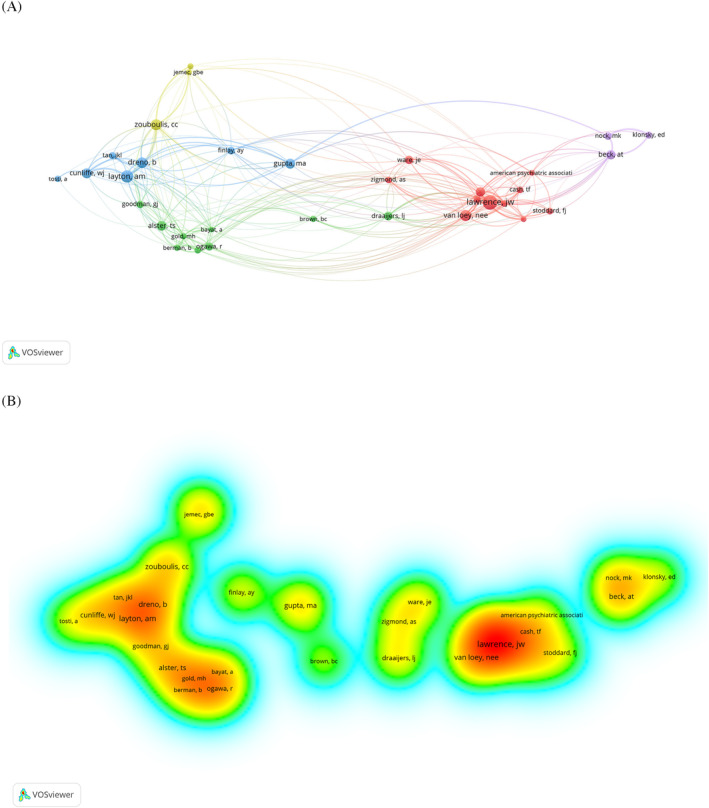
Co‐citation analysis of authors in the field. (A)Visualization of co‐cited networks of authors with over 20 citations per author. (B) Visualization of the co‐citation density of authors cited over 20 times.

Co‐citation analysis of authors in the field. (A)Visualization of co‐cited networks of authors with over 20 citations per author. (B) Visualization of the co‐citation density of authors cited over 20 times.