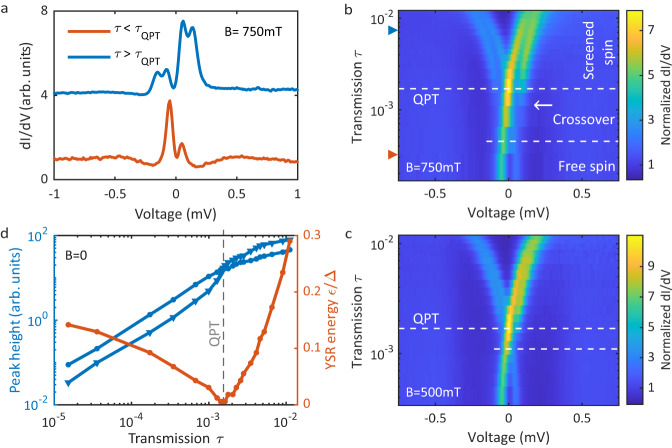
Fig. 2. Magnetic field dependence of YSR states across quantum phase transition (QPT).
a Differential conductance spectra at a magnetic field of B = 750 mT at two junction transmissions, one below and one above the QPT marked by arrows in (b). b Differential conductance map at 750 mT as function of junction transmission revealing the shift of the YSR state across the QPT. The sample is normal conducting, so that the spectral features cross at the Fermi level. c Same as (b) for 500 mT with a correspondingly reduced Zeeman splitting. d YSR peak heights (blue) at zero field of the left and right peak. The height inverts across the QPT, where the YSR energies ε (orange) are zero. The error bars are within the size of the markers.

