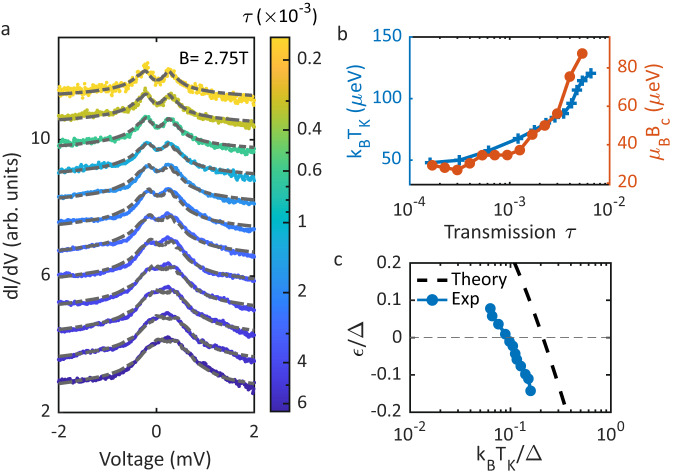
Fig. 4. Kondo effect and numerical renormalization group (NRG) analysis.
a Differential conductance spectra featuring a Kondo peak at different junction transmissions τ. Dashed gray lines represent fits of the data to NRG calculations48. b The Kondo temperature extracted from the fit in (a) as function of transmission τ in blue along with the critical field Bc, above which the Kondo peak starts splitting. c YSR state energy vs. Kondo temperature both scaled to the superconducting gap Δ. The dashed black curve represents the universal scaling predicted from the NRG model. The error bars are within the size of the markers.

