Fig. 1.
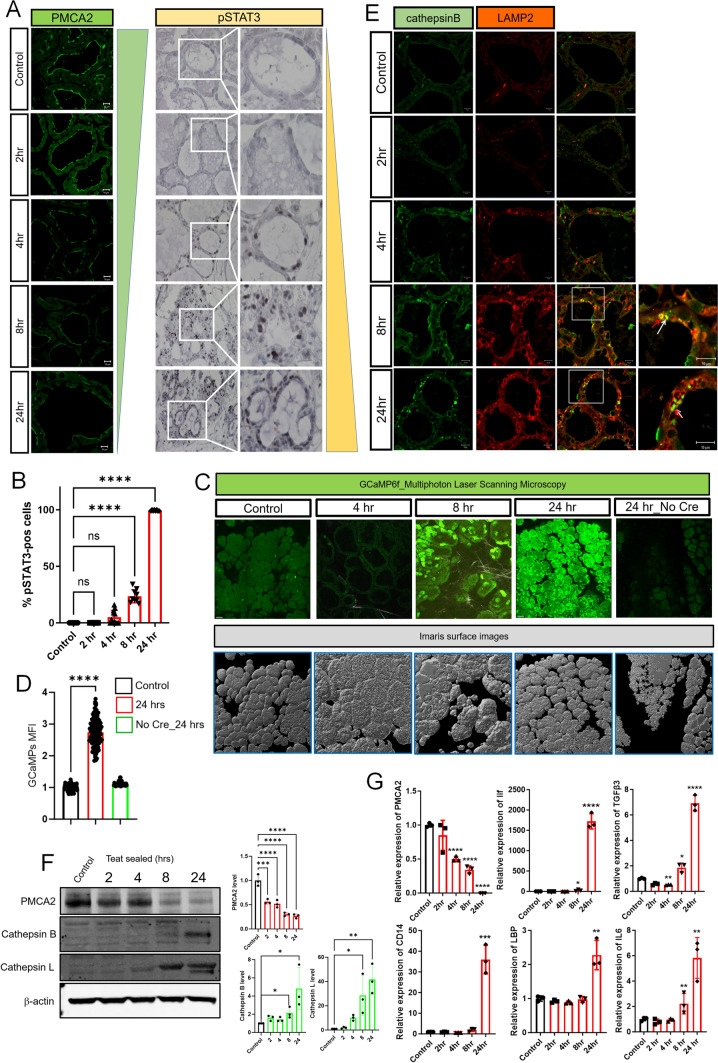
Milk stasis increases intracellular calcium levels. A Immunofluorescence for PMCA2 and Immunohistochemistry for pSTAT3 at 2, 4, 8, and 24 h post teat-sealing mammary gland (representative images of n = 3). Control represents the unsealed contralateral lactating gland. B Quantification of the percentage of pSTAT3-positive epithelial cells in Fig. 1. C Images obtained using multiphoton laser scanning microscopy at 4, 8, and 24 h post teat-sealing of a mammary gland using BLG-GCaMP6flox/lox females. The contralateral, unsealed gland served as a control. Bottom row shows matching imaris surface images (representative images of n = 3). D Mean Fluorescent Intensity (MFI) of MECs in control lactating and 24 h post teat-sealing (n = 3). Mice without Cre expression also served as controls. E Immunofluorescence for Cathepsin B and LAMP2 at 2, 4, 8, and 24 h post teat-sealing mammary gland. (representative images of n = 3). F Western blot analysis of PMCA2, Cathepsin B and Cathepsin L at 2, 4, 8, and 24 h post teat-sealing mammary gland. (n = 3). G PMCA2, Lif, TGFβ3, CD14, LBP, and IL6 mRNA expression in lactating mammary glands (control) and 2, 4, 8, and 24 h post teat-sealing, as assessed by quantitative RT-PCR (QPCR) (n = 3). All scale bars represent 10 μm. Bar graphs represent the mean ± SEM. * denotes p < 0.05, ** denotes p < 0.005, *** denotes p < 0.0005, **** denotes p < 0.00005

