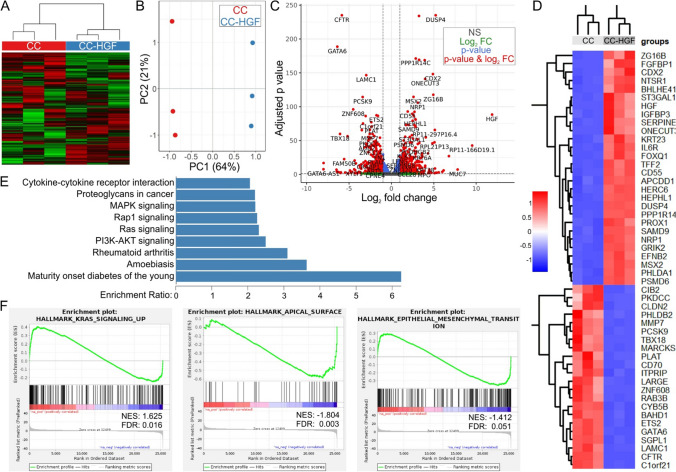
Fig. 3.
Transcriptional reprogramming of cetuximab-sensitive CC cells as a result of HGF overexpression. A All correlation heatmap using top 25% variant genes identified by RNA-seq data from CC and CC-HGF 3D cultures in three independent 3D cultures (type I collagen). B Principal component analysis (PCA) plot of RNA-seq data from CC and CC-HGF 3D cultures in triplicates. C Volcano plot for all comparisons all correlation PCA. Differential expression analysis criteria: absolute fold change ≥ 2 and FDR adjusted p value ≤ 0.05. D Heatmap of top 50 differentially expressed transcripts in CC vs CC-HGF 3D cultures in triplicates; red = up, blue = down (expression scale in inset). E WebGestalt-based CC vs CC-HGF pathway over-representation analysis. KEGG pathways significantly overrepresented (FDR ≤ 0.5) are depicted with their respective enrichment ratios. F Gene set enrichment analysis (GSEA) of RNA-Seq data from CC and CC-HGF cultures. Three select categories of interest are shown and a comprehensive list is shared in Supplementary Fig. S4. Abbreviations: NES = Normalized enrichment score; FDR = False discovery rate q-values

