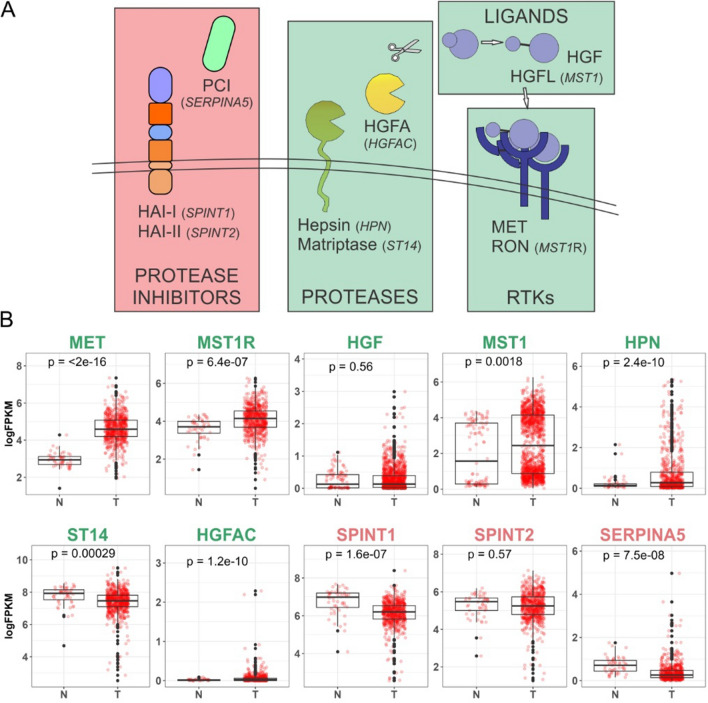
Fig. 6.
Positive and negative regulators of MET/RON pathway and their expression in TCGA CRC data. A Schematic of key signaling molecules in the MET/RON signaling pathway upstream of the receptor; positive regulators are boxed in green while negative regulators are boxed in red. B TCGA expression analysis of the ten MET/RON upstream pathway members; expression of individual genes as indicated in normal (N) colon compared with CRC tumors (T). Consistent with the schematic above, positive regulators of MET/RON signaling are labeled in green while negative regulators are labeled in red. P-values from T test comparison (Wilcoxon rank-sum test) between normal and tumor samples are included on top of each graph and p < 0.05 indicates statistically significant differences

