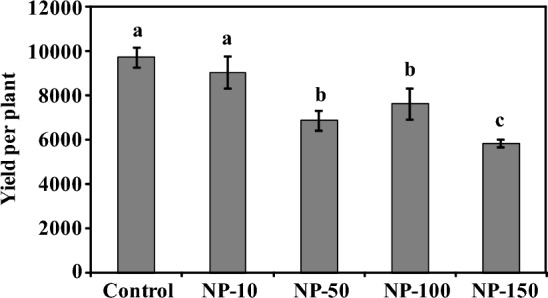
Fig. 6.

The bar graph shows the reduced yield of spinach on MgO-NPs treatment than control plants. The bars represent the yield of 10 plants per treatment. A significant reduction of 22–40% in the spinach yield on NPs exposure was observed on the exposure of NP-50, NP-100, and NP-150 MgO-NPs. Duncan’s multiple range test (DMRT) was applied and different superscript letters on the bars are significantly different at p ≤ 0.05
