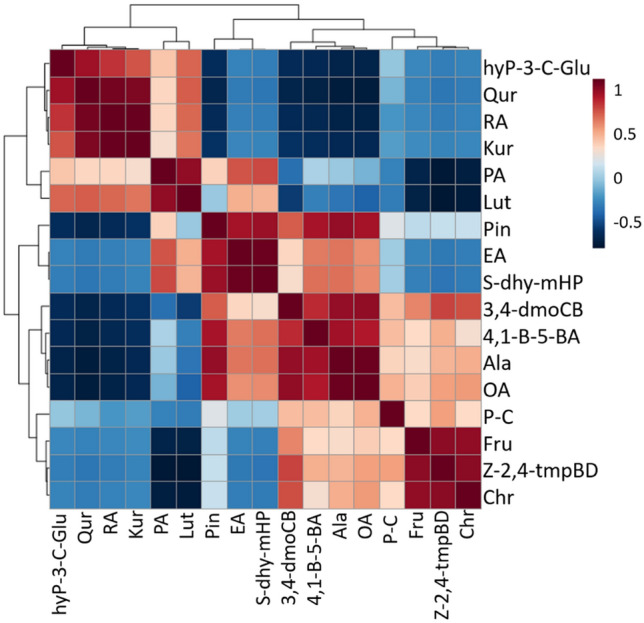
Fig. 8.

The Pearson correlation analysis unveiled the significant correlations among metabolites in three quinoa accessions (CHEN-33, D-12175, and SPrecm). The correlation strength is represented by blue (positive correlation) and red color (negative correlation). (p ≤ 0.001)
