Fig. 9.
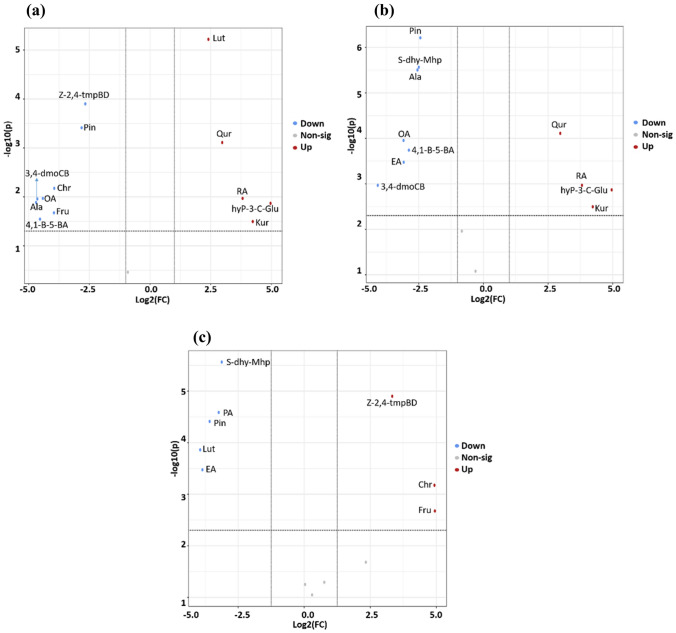
Differentially expressed metabolites among three quinoa accessions: the volcano plots showing expression levels of differential metabolites between D-12175 and SPrecm (a), D-12175 and CHEN-33 (b) SPrecm and CHEN-33 (c). Red, blue, and grey dots indicate the up-, down-regulated, and non-significant metabolites, respectively (color figure online)

