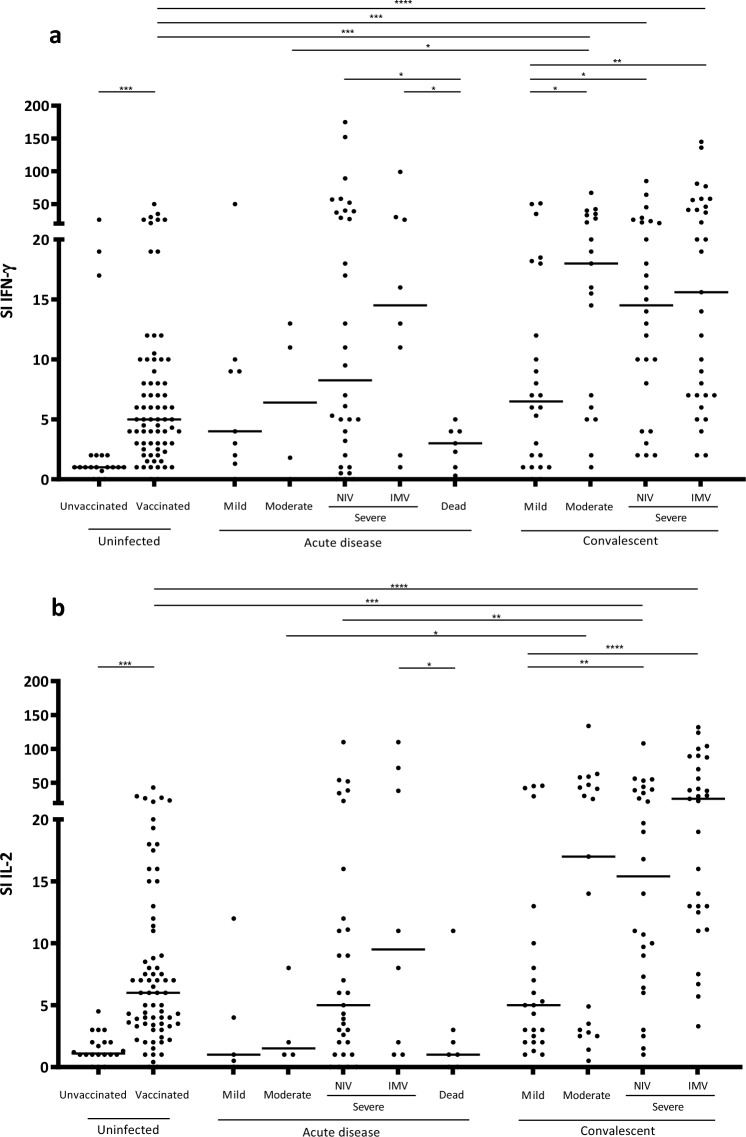
Figure 1.
IFN-γ (a) and IL-2 (b) T-cell responses against the SARS-CoV-2 antigens. The specific response for each cytokine is represented using the SI (stimulation Index). Differences between two group conditions were calculated using the two-tailed Mann–Whitney U test. P is considered significant when < 0.05 (* < 0.05, ** < 0.01, *** < 0.001, and *** < 0.0001). SI: Stimulation index; Non-Invasive Ventilation (NIV); Invasive Mechanical Ventilation (IMV).

