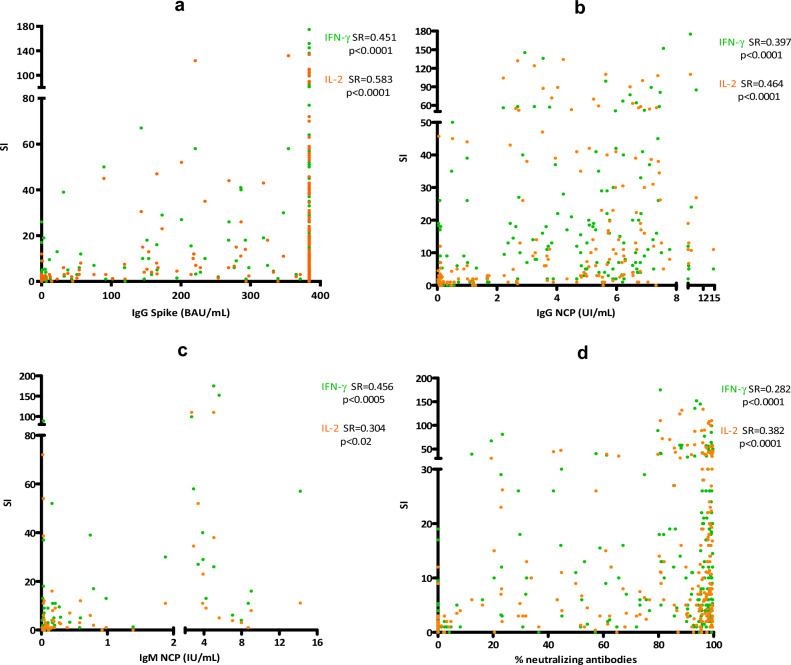
Figure 4.
Correlations between IFN-γ (green) and IL-2 (orange) T-cell response with IgGs against Spike (a), IgGs against NCP (excluding the uninfected vaccinated individuals) (b), IgMs in acute patients (c), and per-centage of neutralization (d). The specific response for each cytokine is represented using the SI. Correlations were calculated using the two-tailed non-parametric Spearman test. In (a), results equal to or over 384 BAU/mL were excluded for statistical analysis (the results including the ones over > 384 BAU/ml maintained significance and moderate correlations: SR IFN-γ = 0.317; SR IL-2 = 0.429). SI: Stimulation index. BAU: Binding antibody units.

