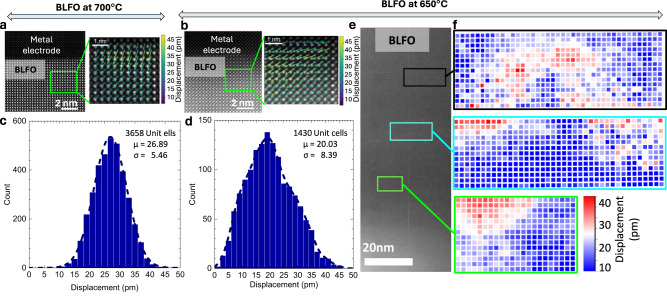
Fig. 2. Atomic imaging and polarization mapping.
Polarization displacement vector mapping on BLFO atomic images collected on the BLFO thin films cross-section deposited at a 700 °C and b 450 °C. Color arrows indicate the magnitude of polarization mapping vis-à-vis atomic displacement. Polarization displacement has been calculated using the Fourier-filtered HAADF-STEM images and the histograms includes the data corresponding to 3658- and 1430-unit cells of BLFO, respectively, for the sample deposited at 700 °C (c) and 450 °C (d). μ is the center of the histogram, or the mean value of atomic displacement and σ is the standard deviation. The dotted line is the smoothening curve. High-temperature BLFO follows the Gaussian distribution, whereas the low-temperature sample shows non-uniform distribution of polarization displacement vector. e HAADF-STEM image of BLFO grown on BPBO at 450 °C. f Represent the corresponding polarization displacement distribution maps across the area of the image at different places. Zoomed TEM images and corresponding polarization displacement distribution plots are represented in Supplementary Fig 8.

