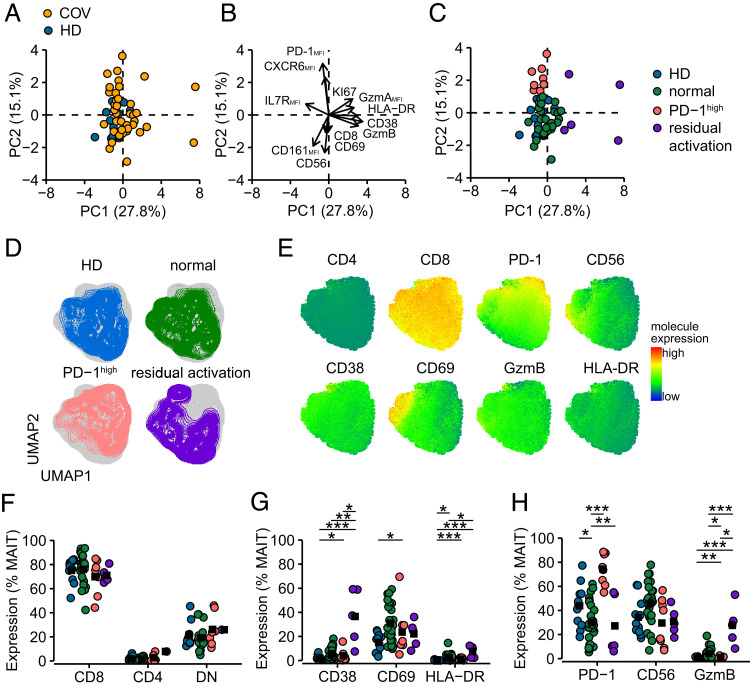
FIGURE 3.
MAIT cell phenotypic heterogeneity in convalescent COVID-19 patients. (A) PCA of MAIT cell phenotypic markers of HDs (n = 11, blue) and convalescent patients with COVID-19 (COV, n = 41, orange). (B) Loadings of principal components PC1 and PC2. The arrow length from origin indicates the loading score. (C) Convalescent patients were identified to have MAIT cell populations with phenotypic characteristics being normalized (n = 28, green), having a PD-1high profile (n = 8, red), or residually activated (n = 5, purple). (D) UMAP plots of MAIT cells from HDs, normalized, PD-1high, and residual activated group at resting conditions. (E) Expression of molecules visualized on the UMAP of MAIT cells at resting conditions. Color indicates expression value. (F) Relative frequencies of MAIT subsets. (G) MAIT cell expression of activation markers and (H) functionally relevant molecules in samples from HDs or patients with normalized, PD-1high, and residually activated MAIT cell pools. Significance of differential protein expression assessed by Kruskal–Wallis test followed by Dunn’s test with Benjamini–Hochberg correction of p values (*p < 0.05, **p < 0.01, ***p < 0.001).

