. 2023 Oct 20;14(1):76–89. doi: 10.1158/2159-8290.CD-23-0964

Figure 2.

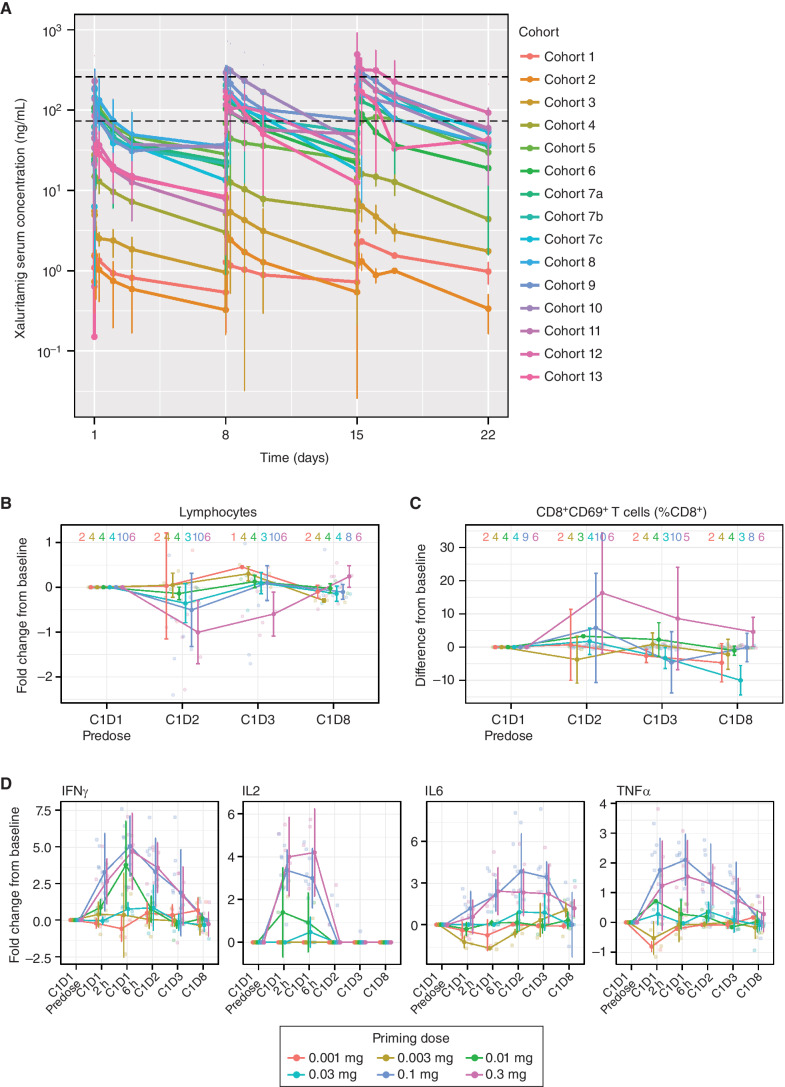
Figure 2. A, Mean (SD) xaluritamig serum concentration vs. time profile by individual cohorts for C1. Black dotted lines represent the lower end of the minimum predicted efficacious exposure based on EC90 for xaluritamig-mediated cell killing in vitro (74 ng/mL) and the upper end of the minimum predicted efficacious exposure based on IC50 for xaluritamig-mediated mouse tumor growth inhibition in vivo (259 ng/mL). Cohort 7c was dosed weekly for C1 and then switched to every 2 weeks starting C2 and beyond, which is not captured in this analysis. At the time of the data cut, there were 94 patients with at least one postbaseline xaluritamig concentration. T-cell pharmacodynamic biomarker response through the first infusion period is dose dependent. Peripheral lymphocyte margination (B), CD8+CD69+ activated T cells as a percentage of total CD8+ T cells (C), and induction of secreted cytokines at the indicated time points after infusion (D). Lines represent median fold change or difference of population percentage from C1D1 predose values ± median average deviation. Transparent points depict individual observations. Sample sizes within each priming dose group at each time point are shown as a strip annotation across the top of each figure. EC, effective concentration; IC, inhibitory concentration.

A, Mean (SD) xaluritamig serum concentration vs. time profile by individual cohorts for C1. Black dotted lines represent the lower end of the minimum predicted efficacious exposure based on EC90 for xaluritamig-mediated cell killing in vitro (74 ng/mL) and the upper end of the minimum predicted efficacious exposure based on IC50 for xaluritamig-mediated mouse tumor growth inhibition in vivo (259 ng/mL). Cohort 7c was dosed weekly for C1 and then switched to every 2 weeks starting C2 and beyond, which is not captured in this analysis. At the time of the data cut, there were 94 patients with at least one postbaseline xaluritamig concentration. T-cell pharmacodynamic biomarker response through the first infusion period is dose dependent. Peripheral lymphocyte margination (B), CD8+CD69+ activated T cells as a percentage of total CD8+ T cells (C), and induction of secreted cytokines at the indicated time points after infusion (D). Lines represent median fold change or difference of population percentage from C1D1 predose values ± median average deviation. Transparent points depict individual observations. Sample sizes within each priming dose group at each time point are shown as a strip annotation across the top of each figure. EC, effective concentration; IC, inhibitory concentration.