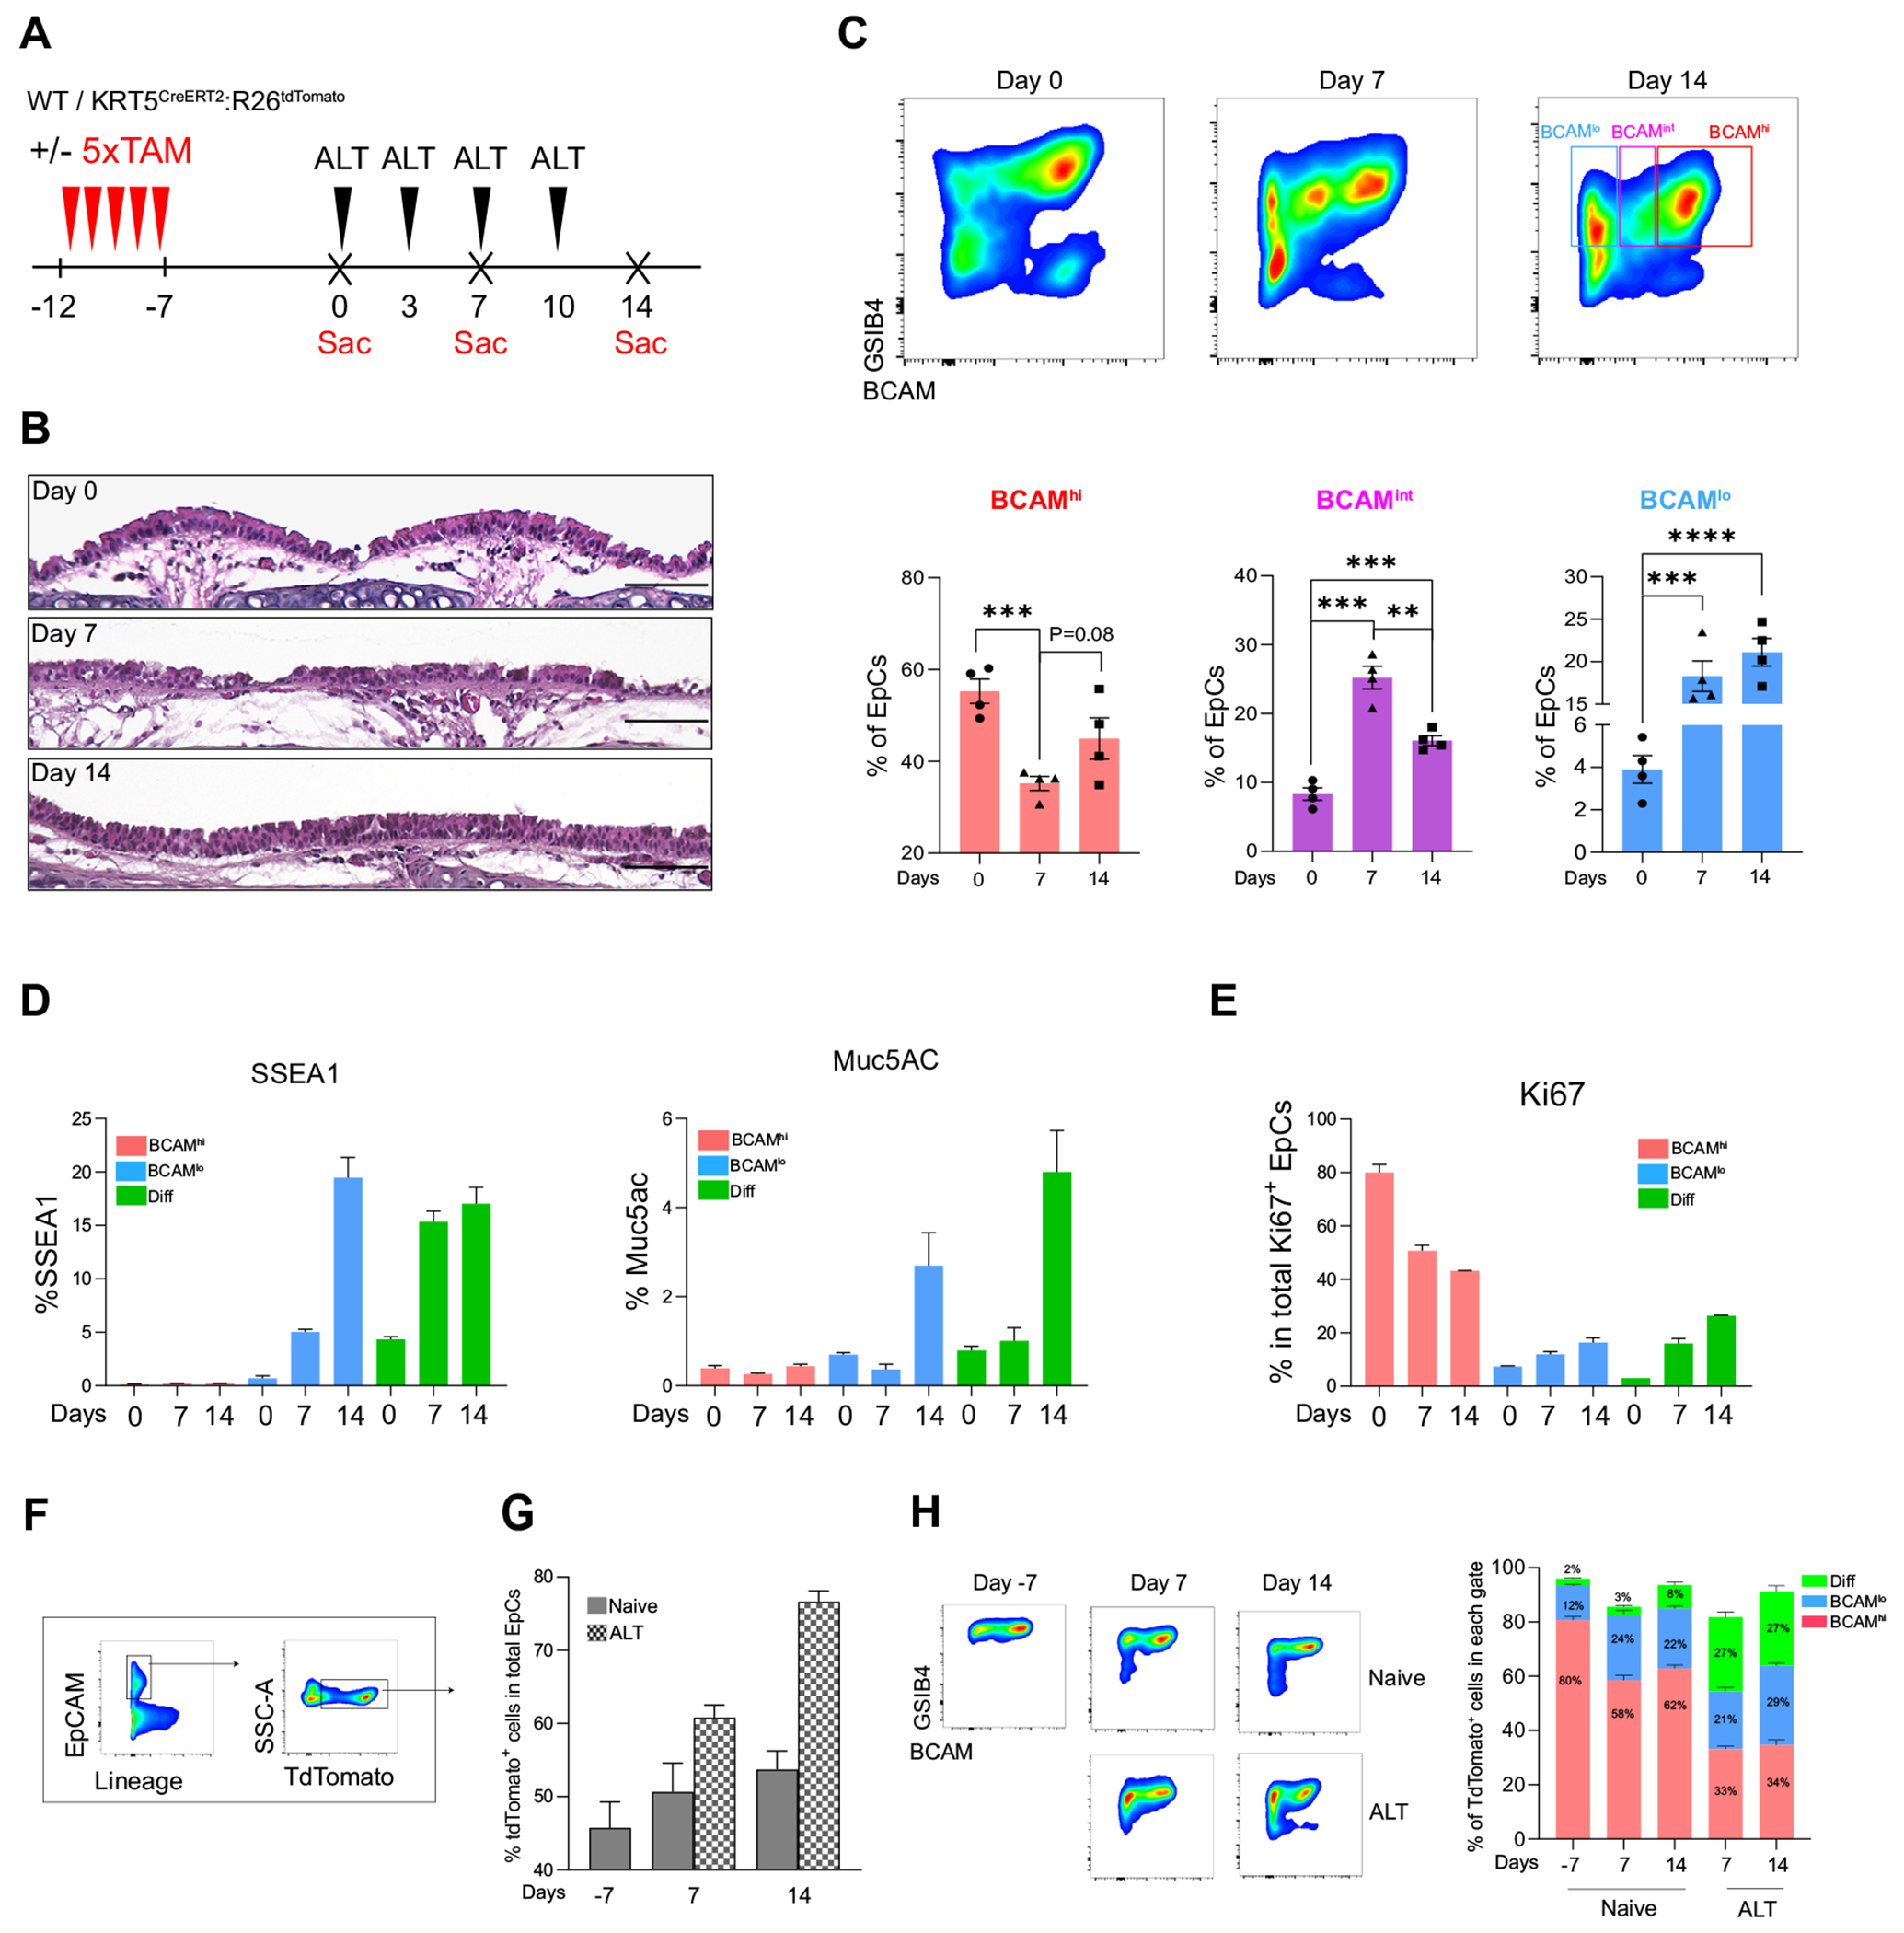
FIG 3.

Fate labeling demonstrates a trajectory from BCAMhi BCs to BCAMlo BCs and then to differentiated EpCs. A, Experimental schema. B, H&E staining of mouse trachea. The scale bar represents 100 μm. Staining is representative of n = 3. C, Flow-cytometric panel showing the percentage of BCAMhi BCs, BCAMint BCs, and BCAMlo BCs in naive and challenged airways. Data are shown as mean ± SEM (n = 4; **P < .01, ***P < .001; unpaired 2-tailed t test). D, Percentage of SSEA1+ cells and MUC5AC+ cells in each EpC subset. Data are shown as mean ± SEM (n = 3). E, Percentage of Ki67+ cells in each EpC subset. Data are shown as mean ± SEM (n = 3). F, Gating strategy identifying tdTomato+ EpCs in KRT5CrerERT2:R26tdTomato mice. G, Percentage of tdTomato+ EpCs out of total EpCs at the indicated time points. Data are shown as mean ± SEM (n = 3). H, A representative image of GSIB4 and BCAM staining on tdTomato+ EpCs (left). Percentage of tdTomato+ EpCs that fall within each gate in naive and ALT at the indicated time points (right). Data are shown as mean ± SEM (n = 3).
