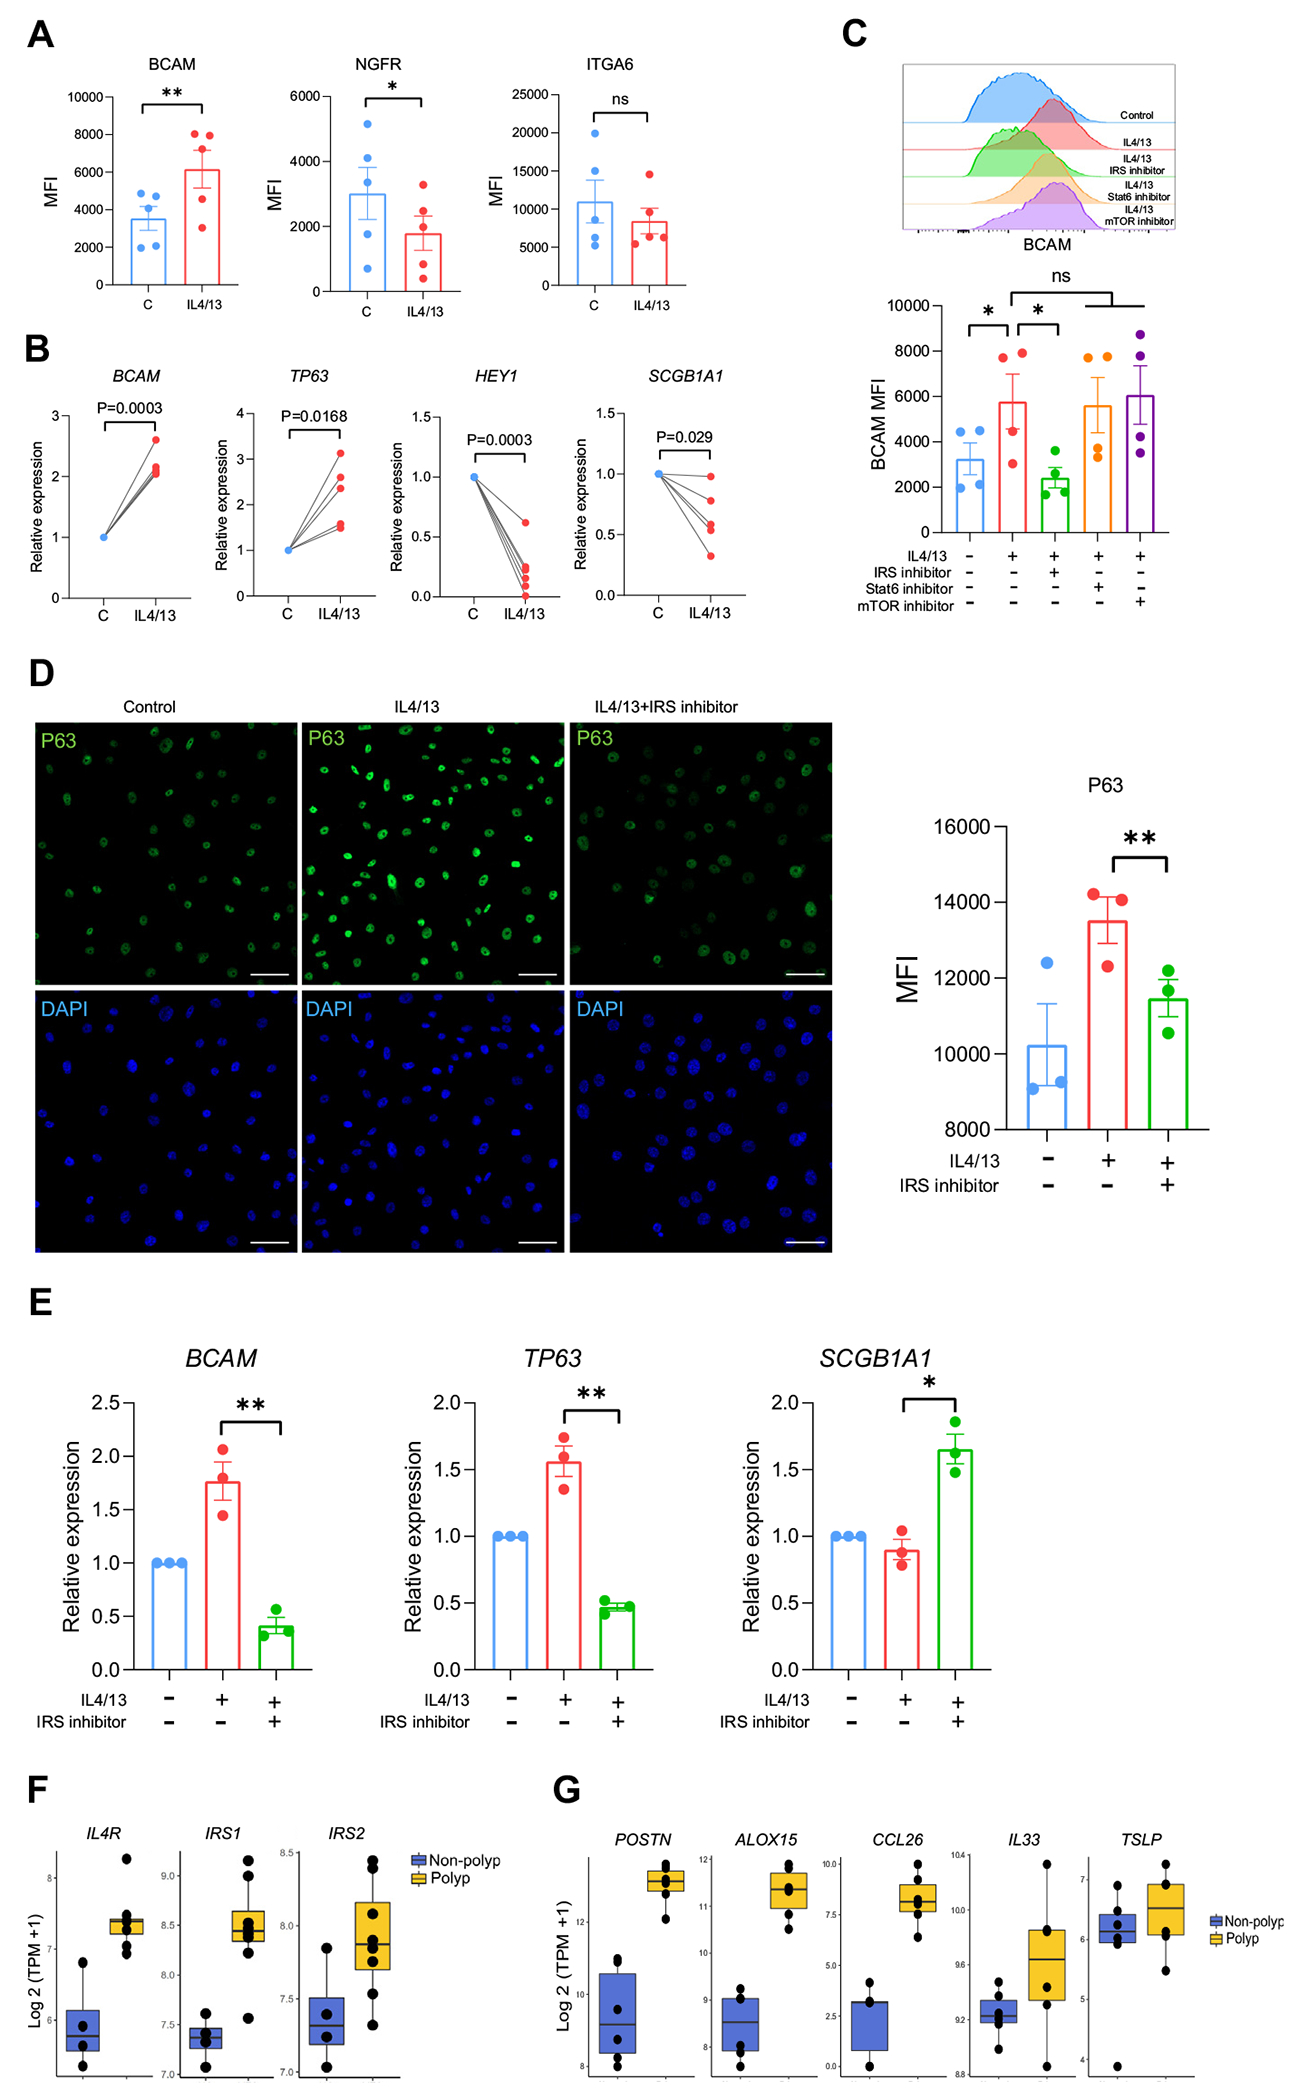
FIG 6.

T2 cytokine–dependent and IRS-dependent regulation of BCAM. A, MFI of BCAM, NGFR, and ITGA6. Data are shown as mean ± SEM (*P < .05, **P < .01; paired 2-tailed t test). B, Quantitative PCR for the indicated genes. Data are shown as mean ± SEM (*P < .05, **P < .01; paired 2-tailed t test). C, Histogram (left) and MFI quantification (right) of BCAM expression in IL-4/IL-13-treated BCs ± inhibitors of IRS-1/2, mTOR, and STAT6. Data are shown as mean ± SEM (*P < .05; paired 2-tailed t test. D, Representative images (left) and MFI quantification (right) of P63 staining on IL-4/IL-13-treated BCs ± an IRS-1/2 inhibitor. Scale bar = 50 μm. Data are shown as mean ± SEM (*P < .05; paired 2-tailed t test). E, Quantitative PCR on IL-4/IL-13–treated BCs ± an IRS-1/2 inhibitor. Data are shown as mean ± SEM (*P < .05, **P < .01; paired 2-tailed t test). Human sinonasal BCs treated ± 10 ng/mL IL-4/IL-13 (Fig 6, A-E). F, Expression of components of IL-4R signaling pathway in bulk BC sequencing from CRSwNP or CRSsNP. IL4R and IRS1 were significantly different (Benjamini-Hochberg–adjusted P values < .05). G, Expression of the indicated genes in scRNA-seq cluster 0 (BCAMhi BCs) from CRSwNP and CRSsNP. Bonferroni threshold (1.59 × 10⁻⁵) for POSTN = 3.21 × 10⁻⁷, CCL26 = 8.97 × 10⁻⁶, and ALOX15 = 1.28 × 10⁻¹⁰. DAPI, 4’-6-Diamidino-2-phenylindole; MFI, mean fluorescence intensity; NS, not significant; TPM, transcripts per million.
