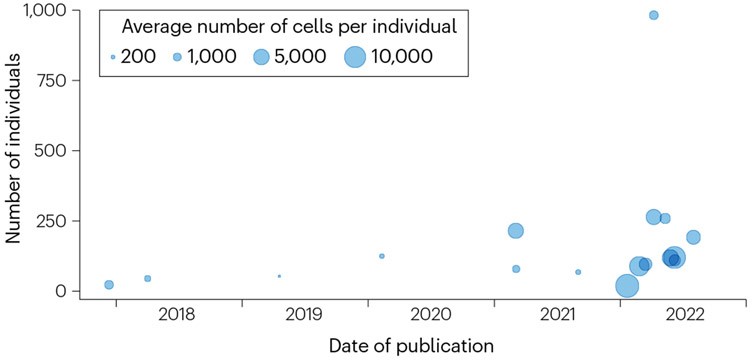
Fig. 1∣. Overview of single-cell expression quantitative trait locus studies.
Single-cell studies published in the past 5 years. On the x axis is the date of publication, and on the y-axis is the number of unique individuals considered. The size of the dots represents the average number of cells per individual included in each study (when this number was not reported in this study, we estimated it as the total number of cells divided by the total number of individuals).

