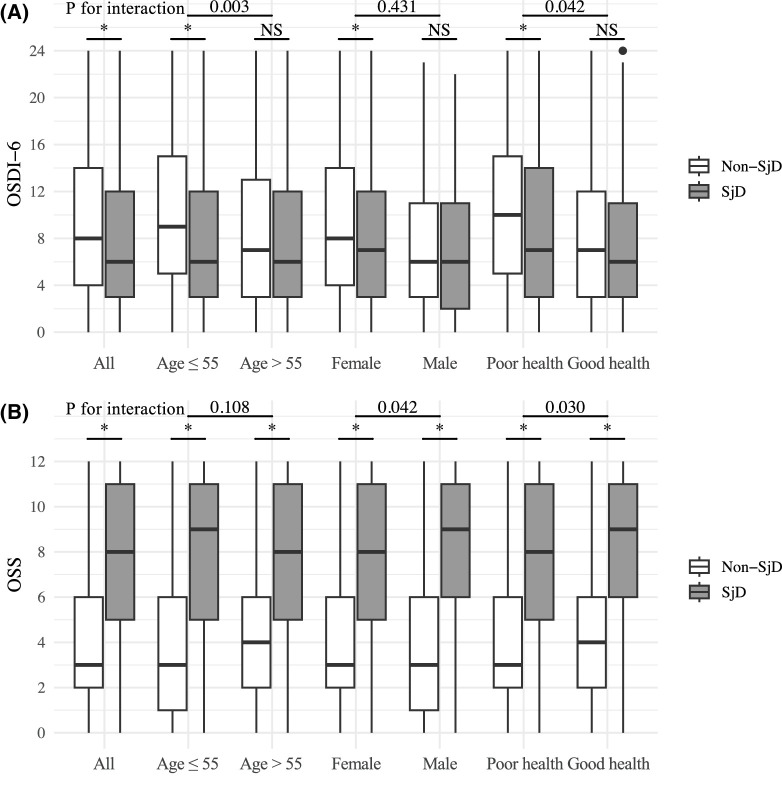
Figure 1.
Box plot depicting difference in ocular symptoms and signs between the SjD and non-SjD participants across all participants and subgroups defined by age, sex, and health status. Horizontal line through each box represents the median. *P < Bonferroni-corrected P value threshold. (A) OSDI-6. (B) OSS. NS, not significant.

