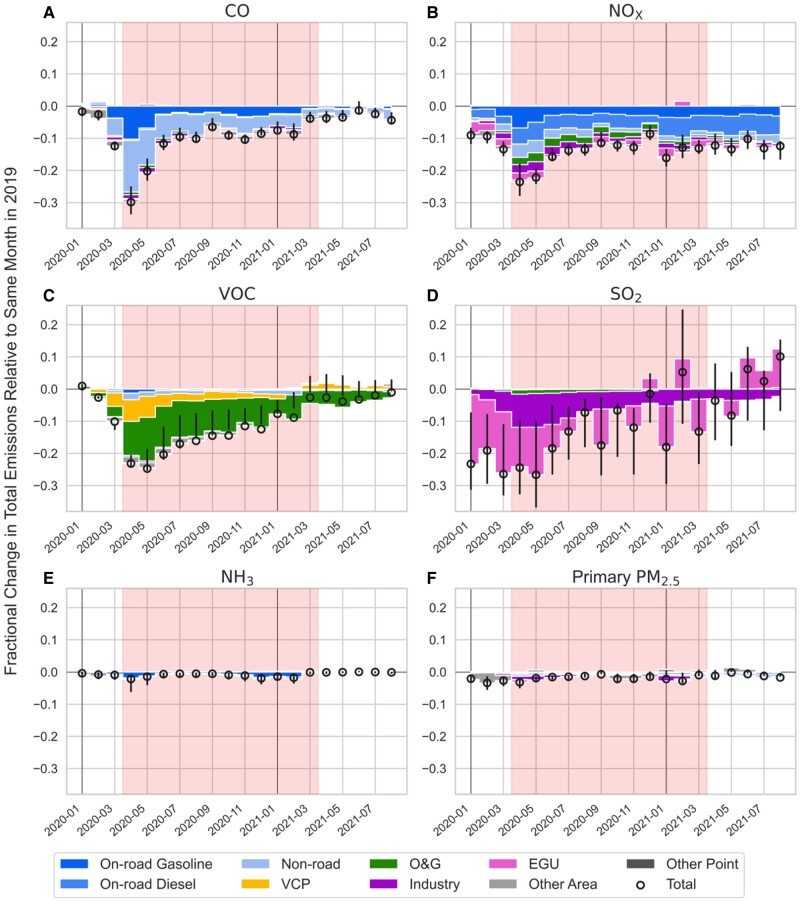
Fig. 1.
Fractional emission changes of major species relative to 2019 by sectors: A) CO; B) NOx; C) VOCs; D) SO2; E) NH3; F) primary fine particulate matter (PM2.5). Shaded areas cover the period of April 2020 to March 2021 for the health impact assessment. The lower and upper limits of the error bars represent 20th and 80th percentile state-level changes with the circle representing US total changes. Note, decreases in O&G emissions arise from a few highly emitting states, and fall below the 20th percentile of state variability trends but drive the overall national VOC trend.

