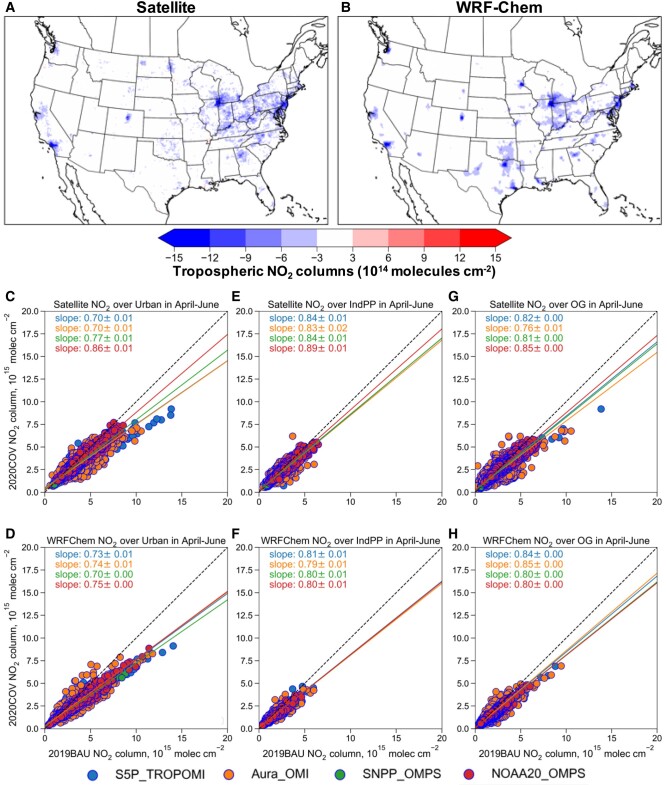
Fig. 2.
Evaluation of simulated tropospheric NO2 column concentrations with multiple satellite observations during between April–June 2019 and 2020. A) Observed NO2 changes based on the average of four satellite instruments (S5P TROPOMI, Aura OMI, S-NPP OMPS, and NOAA-20 OMPS) with air mass factors or shape factors in the satellite products replaced by the model profiles. B) Model simulated NO2 changes based on the average of resampled model data along each satellite track. C–H) NO2 columns over urban (C and D), industrial/power plant (E and F), and O&G (G and H) source regions from satellite data (C, E, and G) and model estimates (D, F, and H) for 2019BAU (x-axis) and 2020 COVID scenario (2020COV, y-axis). Slope is calculated based on the orthogonal distance regression with 95% CI.

