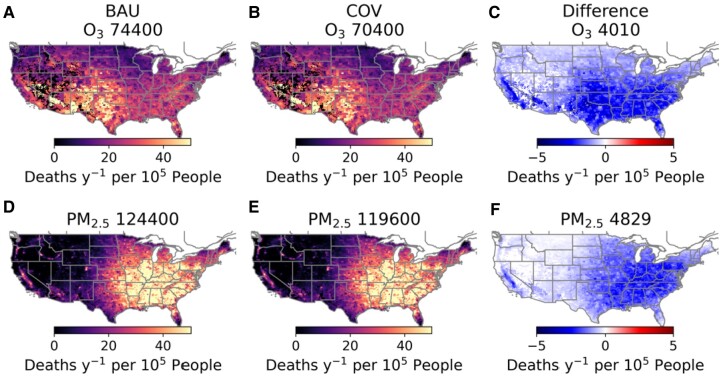
Fig. 4.
O3 and PM2.5 attributable deaths (per year per 105 people) based on BAU (A and D) and COVID scenario (COV, B and E) for April 2020 to March 2021. The total attributable deaths due to each air pollutant and scenario are shown above each figure. C and F) Difference in attributable deaths between BAU and COV scenarios. The difference in the total attributable deaths are shown above each figure.

