Figure 1.

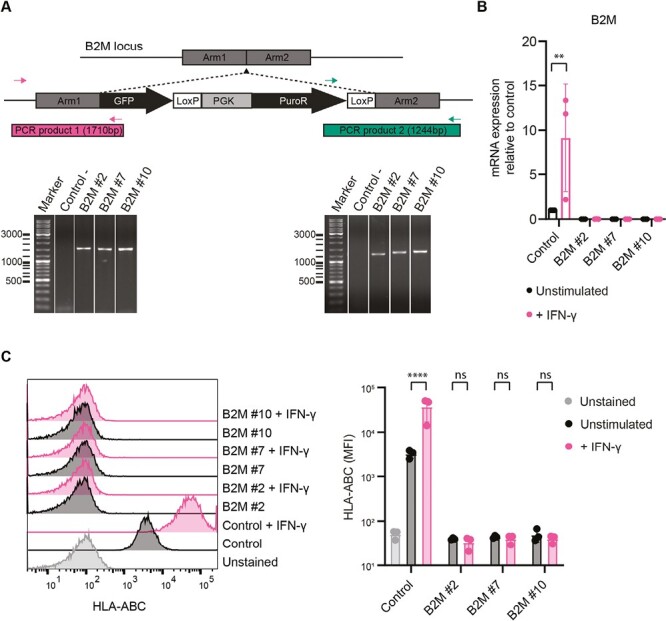
Genetic modification of iPSCs at the B2M locus. (A) Schematic of the genetic modification strategy at the B2M locus by CRISPR-Cas9 and genomic PCR for validation of correct insertion. Two primer pairs were used spanning the homology arms at both ends of the insert, producing PCR products of 1710 and 1244 bp in size. Unmodified control iPSCs were used as negative control (Control-) and the PCR results of 3 B2M–/– clones (#2, #7, and #10) are shown (see also Supplementary Fig. S1). (B) B2M mRNA expression measured by RT-qPCR for control iPSCs and B2M–/– clones in unstimulated and IFN-γ stimulated conditions (n = 3 independent experiments). (C) HLA-ABC surface expression measured by flow cytometry. Unstained control iPSCs were used as negative control and all cell lines were measured in unstimulated and IFN-γ stimulated conditions (n = 3 independent experiments). Results are shown as mean ± SD and significance was evaluated using one-way ANOVA with Šidák’s correction for multiple testing, comparing each sample to its own unstimulated control (ns = not significant, **P < .01, ****P < .0001).
