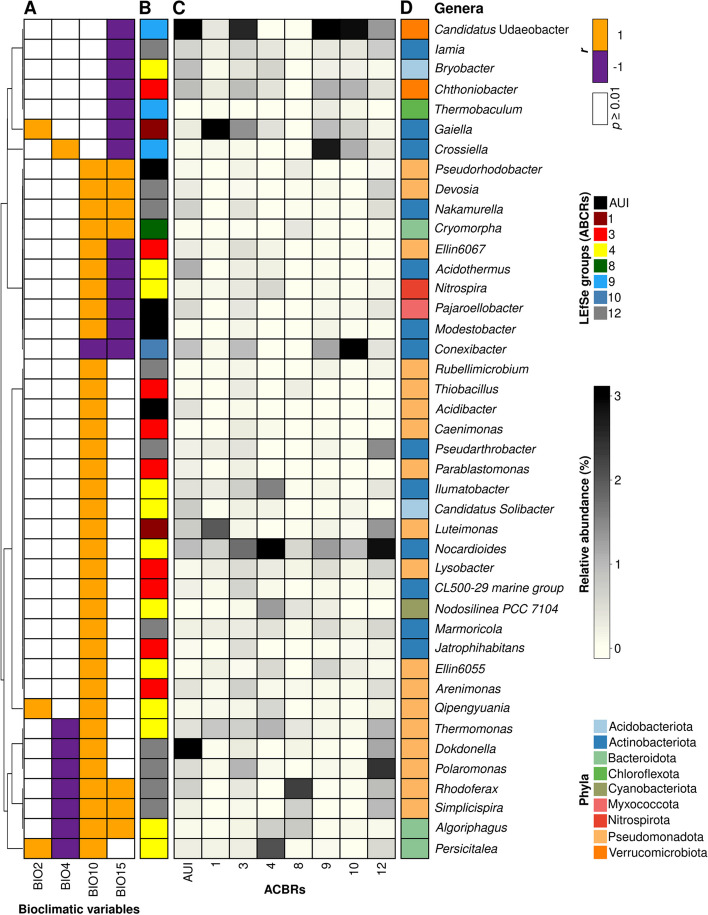
Fig. 7.
Random forest analysis and abundance of selected genera. Semi-partial Spearman’s correlations between relative abundances of dominant genera selected by the random forest analysis (variance explained > 30%) and bioclimatic variables (A). Indicator taxa across ACBRs and AUI (LEfSe analysis based on significant (p < 0.01) Kruskal–Wallis tests) (B). The relative abundance of dominant genera selected by the random forest analysis, with the reported relative abundances are represented by ACBR (C), with associated phylum taxonomic assignment (D). Dominant genera were defined as those with a relative abundance of > 1% in at least one sample that were present in at least 10% of samples. Only samples sequenced with V3–V4 and V4 16S rRNA primers were used for this analysis to ensure the best taxonomic consistency between samples (Varliero et al., 2023). Correspondingly, this approach included samples from AUI (“ACBR unclassified islands “) and ACBRs 1, 3, 4, 8, 9, 10, and 12. BIO2: mean diurnal air temperature range; BIO4: temperature seasonality; BIO10: mean daily mean air temperatures of the warmest quarter; BIO15: precipitation seasonality; BIO18: mean monthly precipitation amount of the warmest quarter; SWE: Snow water equivalent

