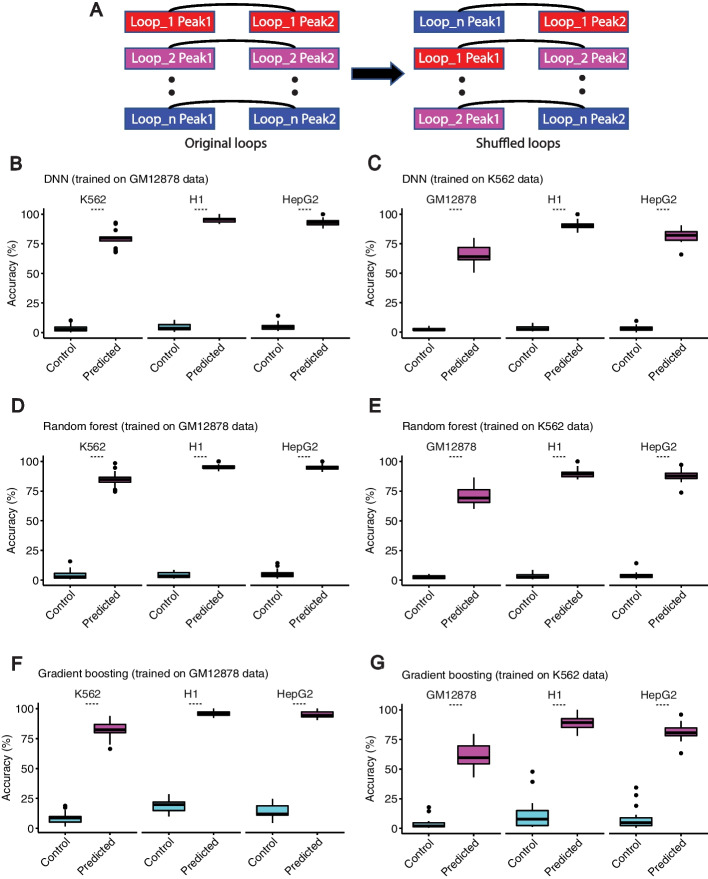
Fig. 4.
Predicted interactions capture the majority of cell-type-dependent loops. A An illustration of how the random control loops were generated for the comparison. B–G Predicted interactions using DNN-ChIPr (B and C), RF-ChIPr (D and E), and GB-ChIPr (F and G) captured a significantly higher portion of the ChIA-PET identified cell-type-dependent loops vs. randomly introduced loops of the same number for the cell lines K562, H1, and HepG2. The models in panels B, D, and F were trained using the data of GM12878 cell line and the models in panels C, E, and G were trained using the data of K562 cell line. ****: p-value < 0.0001, Wilcoxon rank sum test

