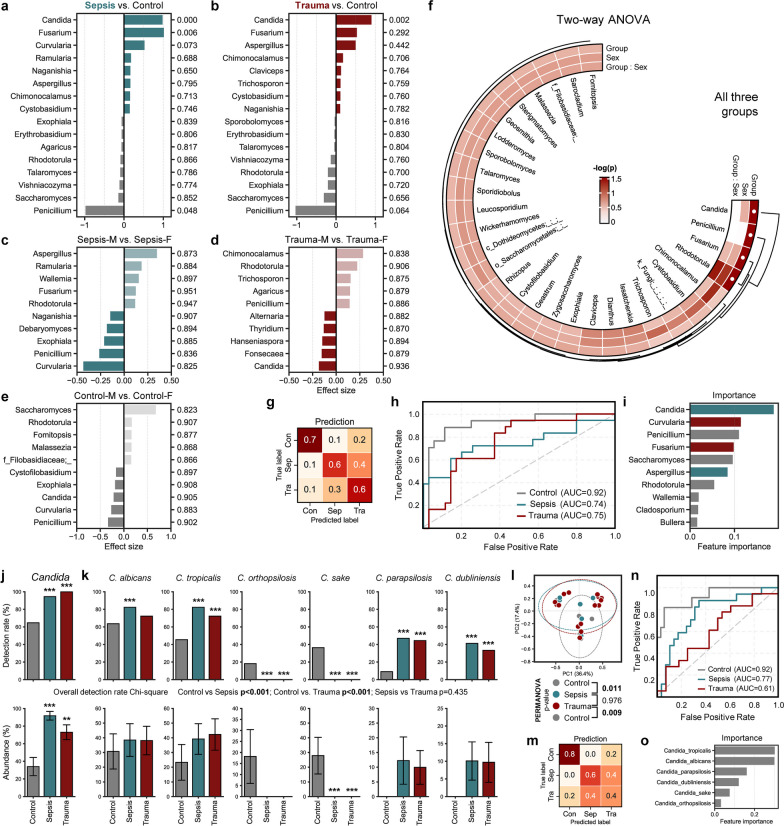
Fig. 2.
Dysbiotic mycobiome signatures in sepsis/trauma patients are primarily linked with pathobiont Candida species. Genera which are significantly more or less relatively abundant in either the a sepsis or the b trauma cohort compared to the control group, with p values displayed on the right column, and c–e differences between same sex-counterparts with associated p values. f Circular heatmaps showing two-way ANOVA results (group and sex) for all three groups comparing the mycobiota. p values were shown by converting to –log (Statistical significance: ● p value < 0.05). g–i A Random Forest prediction model between groups based on abundance data of mycobiome. h Receiver Operating Characteristic (ROC) curve depicts the classification accuracy; while, i a bar graph highlights the top 10 most strongly predictive genera based on relative importance scores. Detection rate and abundance of Candida j genus and k species. Difference in detection rate between groups was assessed using Chi-square test. The abundance of Candida species was determined by calculating the proportion (relative abundance) of each species within the overall Candida genus. l Principal coordinate analysis (PCoA) based on Bray–Curtis dissimilarity calculated with only the abundance of Candida species. m–o A Random Forest prediction model between groups based on abundance data of Candida species. n Receiver Operating Characteristic (ROC) curve depicts the classification accuracy; while, o a bar graph highlights the strongly predictive Candida species based on relative importance scores. **p < 0.01, ***p < 0.001

