Fig. 3.
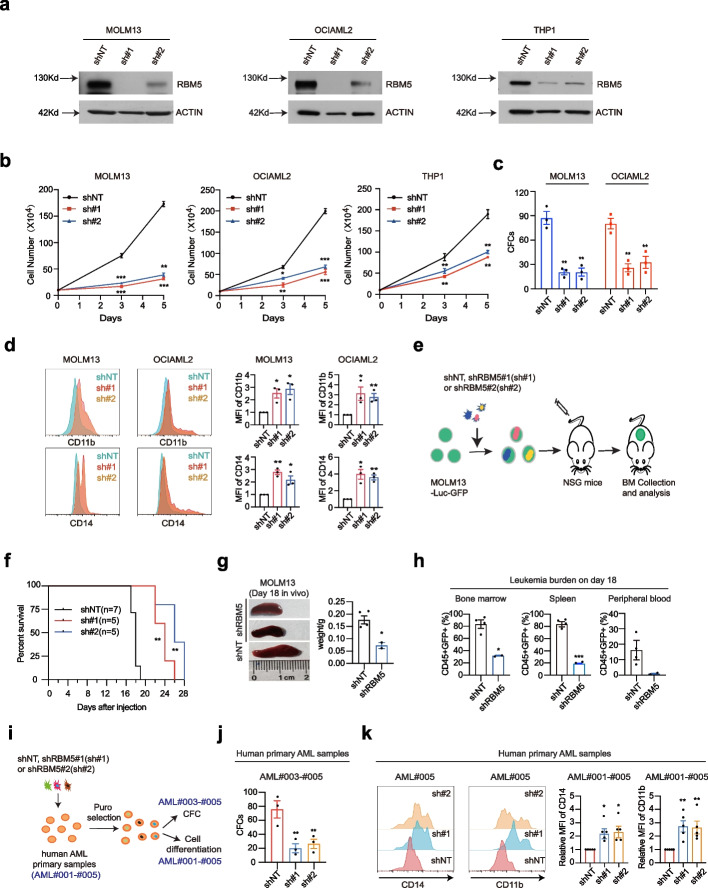
RBM5 knockdown impairs in vivo myeloid leukemia engraftment. a Western blot of RBM5 expression in MOLM13, OCIAML2, and THP1 cells after transduced with shNT (non-targeting control), sh#1 (shRBM5#1), and sh#2 (shRBM5#2) 6-day post-viral transduction. The β-ACTIN was used as a reference. b Cell counting assay was conducted on the sh#1, sh#2, and shNT targeted MOLM13, OCIAML2, and THP1 to monitor the ability of proliferation of AML cells. shNT was used as a negative control. Data shown are means ± SEM from three independent experiments. *P < 0.05, **P < 0.01, ***P < 0.001, unpaired Student’s t-test. c Count of colonies formed by 300 MOLM13 and 500 OCIAML2 cells after shNT, sh#1, and sh#2 transduction. Data shown are means ± SEM from three independent experiments. **P < 0.01, unpaired Student’s t-test. d Surface expression of CD11b and CD14 after lentiviral transduction of shRNA against control shNT and shRNAs targeting RBM5 (sh#1 and sh#2) in MOLM13 and OCIAML2 cells. MFI, mean fluorescence intensity. *P < 0.05, **P < 0.01, unpaired Student’s t-test. e Schematic of in vivo transplantation of MOLM13-Luc-GFP cells infected with control shNT and shRNAs targeting RBM5 (sh#1 and sh#2). f Kaplan–Meier survival curves of recipient mice transplanted with MOLM13 cells transduced with shNT (n = 7), sh#1 (n = 5), and sh#2 (n = 5). The P-value was determined by a log-rank Mantel-Cox test. **P < 0.01. g The spleens of mice in the shNT (n = 4) and shRBM5 (n = 2, merged sh#1 and sh#2) groups were photographed and weighed 18-day post-transplantation. *P < 0.05, unpaired Student’s t-test. h Flow cytometry analysis of the percentage of human CD45+ and GFP+ leukemia cells in bone marrow, spleen, and peripheral blood of recipient mice in the shNT (n = 4) and shRBM5 (n = 2) groups sacrificed after 18-day post-transplantation. Statistical analysis (P-value) was performed using an unpaired Student’s t-test. *P < 0.05, ***P < 0.001. i Schematic diagram of the AML primary sample for CFC and cell differentiation assay. j Count of colonies formed by human primary AML cells after shNT, sh#1(shRBM5#1), and sh#2(shRBM5#2) transduction. **P < 0.01, unpaired Student’s t-test. k Representative flow cytometry analysis of myeloid differentiation marker (CD14 and CD11b), in which AML primary samples were treated with lentiviral transduction of shRNA against control gene (shNT) and shRNAs targeting RBM5 (sh#1 and sh#2). MFI, mean fluorescence intensity. *P < 0.05, **P < 0.01, unpaired Student’s t-test

