Figure 7.
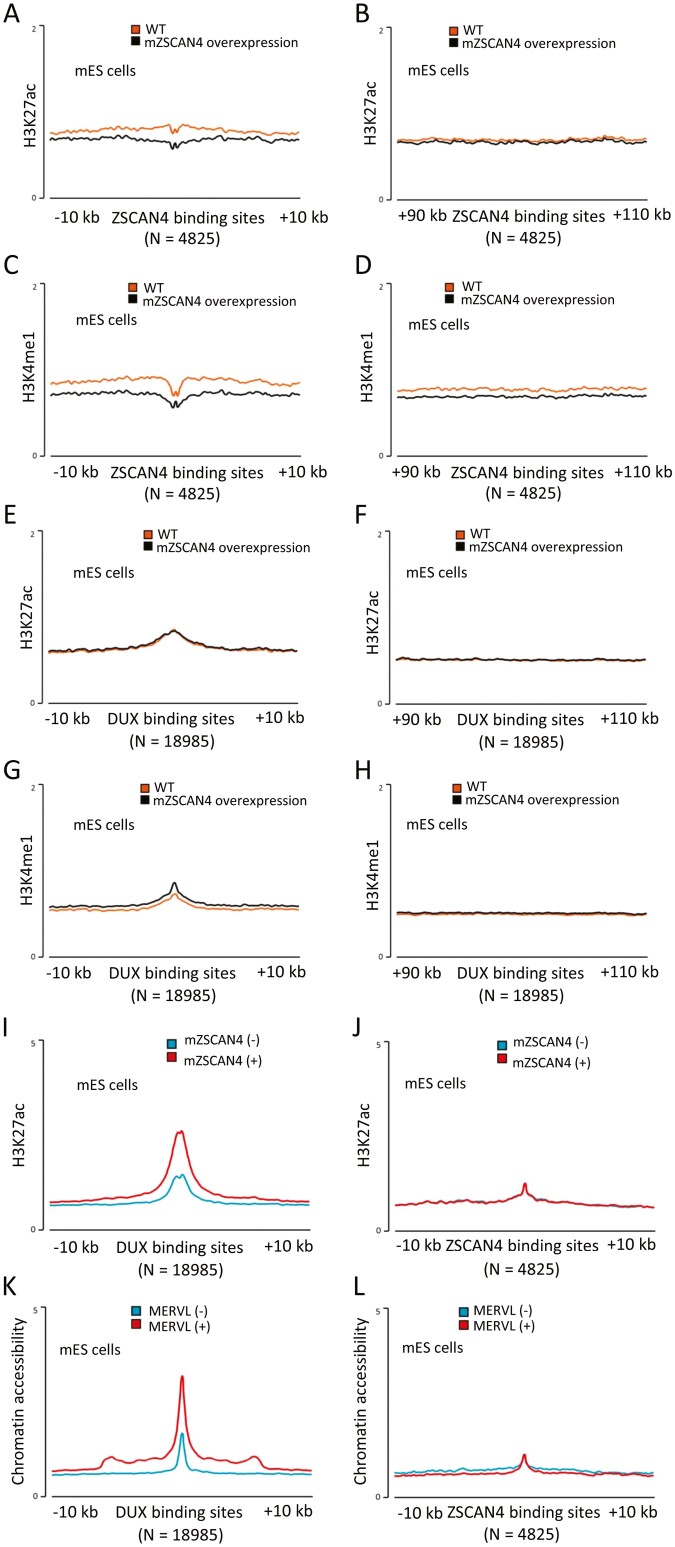
Histone modifications and chromatin accessibility at the mZSCAN4-binding sites. (A) Average H3K27ac ChIP-seq profiles around mZSCAN4 binding sites (N = 4,825) in wildtype mES cells (WT) and mES cells overexpressing ZSCAN4 (ZSCAN4 overexpression). (B) Average H3K27ac ChIP-seq profiles around mZSCAN4 binding sites + 100 kb (N = 4,825) for controls. (C) Average H3K4me1 ChIP-seq profiles around mZSCAN4 binding sites (N = 4,825) in WT and mZSCAN4 overexpressing mES cells. (D) Average H3K4me1 ChIP-seq profiles around mZSCAN4 binding sites + 100 kb for controls. ChIP-seq data were reanalysed from previously published data.18 (E) Average H3K27ac ChIP-seq profiles around DUX binding sites (N = 18,985) in wildtype mES cells (WT) and mES cells overexpressing ZSCAN4 (ZSCAN4 overexpression). (F) Average H3K27ac ChIP-seq profiles around DUX binding sites + 100 kb (N = 18,985) for controls. (G) Average H3K4me1 ChIP-seq profiles around DUX binding sites (N = 18,985) in WT and mZSCAN4 overexpressing mES cells. (H) Average H3K4me1 ChIP-seq profiles around DUX binding sites + 100 kb (N =18,985) for controls. ChIP-seq data were reanalysed from previously published data.18 (I) Average H3K27ac ChIP-seq profiles around DUX binding sites (N = 18,990) in ZSCAN4 (−) and ZSCAN4 (+) cells. (J) Average H3K27ac ChIP-seq profiles around mZSCAN4 binding sites (N = 4,825) in ZSCAN4 (−) and ZSCAN4 (+) cells. Previously generated ATAC-seq data12 were reanalysed for A and B, and previously generated H3K27ac ChIP-seq data6 were reanalysed for C and D. (K) Average ATAC-seq profiles around DUX binding sites (N = 18,990) in MERVL (−) and MERVL (+) cells. (L) Average ATAC-seq profiles around mZSCAN4 binding sites (N = 4,825) in MERVL (−) and MERVL (+) cells.

