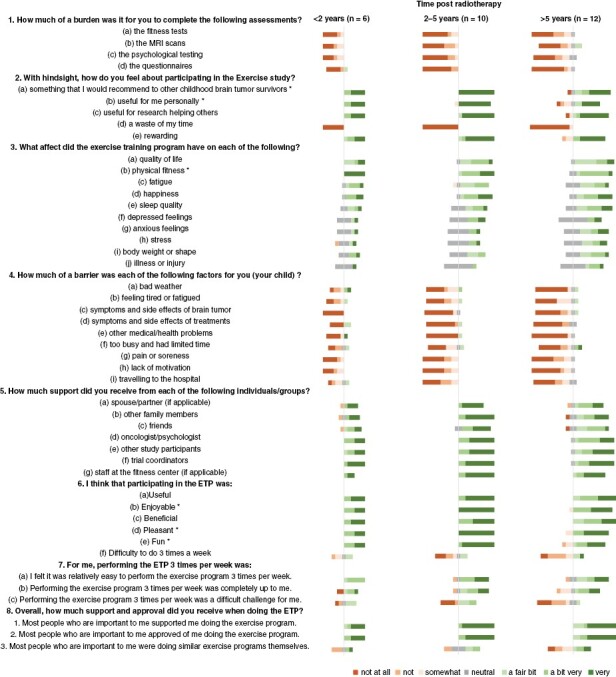
Figure 1.

Satisfaction questionnaire: Details of responses by item and by groups. This bar chart shows the frequency of responses to the Likert items on the satisfaction questionnaire, which measures respondents’ levels of agreement (right part, green shading) or disagreement (left part, red shading) with each item. ET program: exercise training program. * significant difference between group (P < .05).
