

Abstract

Mesoporous silica nanoparticle-decorated graphene oxide nanosheets (MSiO2-GO) were synthesized and characterized for the active removal of lead (Pb2+) from the water. MSiO2 NPs were prepared via an ultrasonication method using tetraethyl orthosilicate (TEOS), and GO sheets were obtained via a modified Hummers’ method. X-ray diffraction, UV–vis spectroscopy, Fourier transform infrared spectroscopy, and energy dispersive X-ray spectroscopy specified the composition of MSiO2 NPs and GO sheets. The surface charge and texture of the MSiO2-GO nanosheets were obtained using the ζ-potential technique and by field emission scanning electron microscopy. The relative cytotoxicity test of MSiO2 NPs and MSiO2-GO nanosheets was performed on Murine Raw 264.7 cells before implying the treatment of water. Adsorption of Pb2+ ions on MSiO2-GO nanosheets was examined at various parameters such as different aqueous pH values (2.0–10.0), MSiO2-GO nanosheet doses (3, 5, 10, 15, 20 mg L–1), time intervals (2–30 min), and temperatures (25–45 °C). About 90% of Pb2+ ions were removed from water within 30 min (MSiO2-GO dose: 15 mg L–1; initial Pb2+ ions: 50 mg L–1; temperature: 25 °C; shaking speed: 200 rpm). The maximal uptake of Pb2+ was obtained at solution pH 6.0. Pseudo-first- and pseudo-second-order kinetic rate equations describe the sorption dynamic data. Pb2+ sorption isotherms were modeled using the Freundlich and Langmuir isotherm models. The possible mechanism of binding of Pb2+ ions onto MSiO2-GO nanosheets has been discussed. The exhausted MSiO2-GO nanosheets were successfully regenerated using 0.005 M HNO3 as the desorbing agent.
1. Introduction
Water pollution with heavy metals is a chronic problem plaguing almost all countries. The industrial and anthropogenic activities have made the situation worse. Since the heavy metals easily seep into water through the earth’s surface, a reliable and economical solution to get rid of these contaminations from water is of utmost importance.1−3 Moreover, these heavy metals, in the long run, are extremely hazardous for humans, plants, and animals.2,3 Lead (Pb2+) is one such heavy metal that is extremely toxic even in small amounts.3,4 The contamination of the water by lead could be due to many activities such as discharging of untreated wastewater of battery and paint industries, through water supply pipes since metal pipes contain lead.5−8 Out of the various methods available for the separation of heavy metals from water, the adsorption technique is most favored due to its economic viability and simplicity.7−9
Recently, the carbon-based material graphene oxide (GO) has been making ripples in the research arena due to the various outstanding properties it holds that could pave the way to numerous applications.10,11 One of the potential applications of GO which has recently been explored is as a new sorbent for the purification of water, due to its excellent properties such as large surface area, high mobility of charge carriers, low cost, eco-friendliness, and thermal and chemical stability.11,12 Also, hexagonal arrays of carbon atoms provide strong fundamental interactions with other molecules.4 Furthermore, engineered GO nanosheets contain several functional groups such as hydroxyl (−OH), carboxyl (−COOH), and epoxy groups (–C=O).12,13 These functional groups increase the dispensability of GO and enhance the excellent adsorption sites for various contaminants, including metal ions in water.
However, GO layers have a significant demerit of aggregations, which leads to the folding of graphene sheets, thereby reducing its specific surface area, mechanical strength, and structural properties, hence reducing adsorption capacities.12,13 Therefore, the incorporation of metal/metal oxide/nonmetallic oxide nanoparticles in the GO nanosheets or modification of GO with specific functional groups may decrease the aggregation and increase its mechanical strength and hence the active surface area.9,13
The incorporation of nanoparticles into the GO layer prevented not only useful aggregation of single GO sheets but also that of nanoparticles themselves.9 Besides, GO-based composites with a more massive surface area show excellent properties compared to bare nanoparticles due to the interactive effect of nanoparticles and graphene sheets.
In the present study, silica nanoparticles have been used for intercalation in GO sheets since they offer certain advantages, such as low cost, innocuity, easy availability, chemical stability, biocompatibility, large specific surface areas, uniform pore size, and reproducibility.3,9 However, one of the practical disadvantages of using the nanoparticles alone for the treatment of water from heavy metals is that it is difficult to strip out nanoparticles from the aqueous solution after treatment.14 This assumes critical importance in applications such as heavy metal removal from water where regeneration of the adsorbent is necessary. The nanoparticle-inoculated GO sheet, on the other hand, is quite easy to strip out from water.1,9,14,15
Thus, in the present work, silica NPs were embedded in the GO layer to decrease the folding nature of GO sheets, thereby increasing its mechanical strength. Herein, mesoporous silica nanoparticles decorated with GO sheets (MSiO2-GO) were synthesized and then applied as sorbents for the effective elimination of lead ions from water. It has been reported in the literature that nanoparticles have toxic and inflammatory effects on living cells.16 This demands the cytotoxicity test of nanoparticles before they are applied to the exclusion of metal ions from water. Thus, the cytotoxicity test of MSiO2-GO nanosheets was investigated on the Murine cells before incorporating it into the water.
2. Synthesis of the GO/SiO2 Composite
2.1. Materials
The chemicals along with their purity used for the synthesis of GO sheets and SiO2 nanoparticles are listed here: (i) tetraethyl orthosilicate (TEOS, 98.0%, Sigma-Aldrich), (ii) ammonium hydroxide (NH4OH) (28–30%), ethanol (99.5%), hydrochloric acid (HCl, 1 M), and sodium hydroxide (NaOH, 1 M) (all AR grade, Thermo Fisher Scientific, India), (iii) lead nitrates [Pb(NO3)2] (99.0%) purchased from Thomas Baker (Chemicals), India, (iv) potassium permanganate (KMnO4) (99%, RFCL), sodium nitrate (NaNO3) (98%, Nice Chemicals), graphite flakes (acid treated 99%, Asbury Carbons), hydrogen peroxide (H2O2) (40 wt %, Emplura), hydrochloric acid (HCl) (35%, RANKEM), and sulfuric acid (H2SO4) (98%, ACS), and (v) 6-diamidino-2-phenylindole dihydrochloride (DAPI), rhodamine phalloidin, and 4′ procured from Invitrogen, phosphate buffered saline (PBS) and paraformaldehyde procured from HI Media, Dulbecco’s modified Eagle medium (DMEM) from Gibco, and Raw 264.7 cells from NCCS, Pune. The entire chemicals and reagents were used as received without further purification.
2.2. Synthesis of GO Sheets
GO sheets were prepared via the modified Hummers’ method through the oxidation of graphite flakes.17 Initially, 2 g each of graphite flakes and sodium nitrate was dissolved in H2SO4 (50 mL) in a volumetric flask kept in an ice bath (0–5 °C) with constant stirring for 2 h. Simultaneously, 6 g of KMnO4 was added to the suspension slowly while maintaining the reaction temperature at <15 °C. After that, the ice bath was removed from the suspension, and the solution was stirred further at 35 °C until it turns to pasty brownish. The suspension was then diluted slowly by the addition of 100 mL of distilled water. The temperature of the reaction rises rapidly to 98 °C, turning the color of the suspension to brownish. The solution was further diluted by adding 200 mL of distilled water with continuous stirring. To terminate the reaction, 10 mL of H2O2 was added. The yellow color appeared, signifying the termination of the reaction. Finally, the mixture was washed several times via centrifugation using 10% HCl and distilled water several times. The final suspension was then vacuum-filtered by using a 1:1 volume ratio of water and ethanol. The obtained product was kept for drying in an oven at 40 °C. GO nanosheets were ground and collected in the powder form. The synthesis steps of graphene oxide nanosheets are displayed in Figure 1 (1st step).
Figure 1.

Synthesis process of GO sheets (1st step) and MSiO2 NPs and MSiO2-GO nanosheets (2nd step).
2.3. Synthesis of MSiO2 NPs
Mesoporous uniform-sized silica nanoparticles (MSiO2 NPs) were synthesized by hydrolysis of TEOS in water–ethanol emulsion medium along with the ammonium hydroxide as reported in our earlier work.18 First, 30 mL of water–ethanol medium (10 mL of water + 20 mL of ethanol) was kept for 30 min in an ultrasonication bath. Simultaneously, 10 mL of TEOS was added dropwise to the ultrasonication process. At the same time, 25% of NH4OH was added dropwise to endorse the condensation of the reaction. Ultrasonication was further continued for 60 min to obtain a turbid white suspension. The fluid segment was separated by vacuum filtration and washed five times with ethanol/water medium (1:2 ratios). The remaining substantial portions were dried in an oven for 6 h at 60 °C and appropriately ground. Figure 1 (2nd step) shows an experimental procedure for the synthesis of uniformly sized mesoporous silica NPs. Below the reaction is the formation of MSiO2 NPs.
| 1 |
| 2 |
2.4. Synthesis of Nanosorbent MSiO2-GO Nanosheets
MSiO2-GO nanosheets were prepared by dispersing 0.4 g of silica nanoparticles in 30 mL of ethanol and stirring for 1 h. Simultaneously, 0.2 g of GO sheets was added to aqueous silica, and the mixture was stirred for 1 h. The suspension was then placed for 30 min for ultrasonication to get the proper dispersion. Finally, the suspension was vacuum-filtered, and the residue was washed five times using ethanol–water medium. The obtained solid product was dried in an oven at 60 °C and appropriately ground. Figure 1 (2nd step) displays the detailed synthesis of the MSiO2-GO nanosheets.
2.5. Characterization of Nanosorbent MSiO2-GO Nanosheets
2.5.1. X-ray Diffraction (XRD) Analysis
The structure, crystallinity, composition, and phase of the prepared GO nanosheets, MSiO2 NPs, and MSiO2-GO sheets were obtained using an analytical system diffractometer (model: DY-1656) using Cu Kα (λ = 1.542 Å).
2.5.2. High-Resolution Transmission Electron Microscopy (HRTEM) Analysis
To observe the size and surface morphology of the prepared nanoparticles, HR-TEM using a JEOL-2100 F (Japan) was used. Samples were prepared by dispersing a pinch of NPs in ethanol medium and ultrasonicated. Then, it was drop-cast on copper grids and kept for drying at room temperature.
2.5.3. Field Emission Scanning Electron Microscopy (FE-SEM) Analysis
The surface texture, morphology, and stage of aggregation were investigated via FESEM, Te-scan Model LYRA 3 XMU.
2.5.4. Fourier Transform Infrared (FTIR) Analysis
The surface composition of the prepared nanosorbents and the vibrational state of the adsorbed molecules were confirmed by using FTIR spectroscopy (Varian 7000). The sample for characterization was prepared by the KBr pellet method.
2.5.5. ζ-Potential Analysis
The surface potential of the synthesized nanosorbents was obtained from the measurement of the ζ-potential (model ZC-2000, Microtech, Japan). The small amount of NPs was dispersed in distilled water to prepare samples. The solutions were diluted to determine the surface charge of streaming particles.
2.5.6. BET (Brunauer–Emmett–Teller) Surface Area and Pore Size
The BET surface area and pore size of the synthesized NPs were obtained by using a Quanta chrome analyzer (model Autosorb-1). A 0.15 g amount of NPs was degassed at 200 °C for 6 h.
2.5.7. Atomic Absorption Spectrometry (AAS) Analysis
Lead ion detection in aqueous solution was determined through AAS, Savant AA, Australia. This technique is used for determining the concentration of particular elements (the analyte) in a sample.
2.6. In Vitro Cytotoxicity Test
The cells were treated with MSiO2 NPs and MSiO2-GO nanosheets and analyzed via a methyl-thiazole tetrazolium (MTT) assay to perform a cytotoxicity test. DMEM medium was used to culture macrophage cell lines (Raw 264.7) from Murine blood. The subconfluent flask cells were seeded into 96-well culture plates with 20 × 103 cells/well. Proper attachment of cells was achieved by incubating them overnight. Variable doses of MSiO2/MSiO2-GO nanosheets (5, 10, 20, 30, 40, and 50 μg mL–1) were used to treat cells. The culture media were discarded after a period of 24 h, and subsequently, 0.5 mg mL–1 MTT solution was added to each well. Furthermore, the plates were incubated for 4 h to form formazan crystals; at the same time, crystals were dissolved in DMSO for 10 min. Absorbance was then taken at 570 nm using a microplate reader GMB-580. The cell viability % for each dose of MSiO2/MSiO2-GO nanosheets was measured, and a graph was plotted by using GraphPad Prism software (Graph Pad Software Inc.). All experiments have been carried out thrice.
2.7. Cell Morphology
The consequence of varying doses (5–50 μg mL–1) of MSiO2/MSiO2-GO nanosheets on the cells’ morphology was determined as described in detail elsewhere.18 Treatment of cells was done separately using 40 μg mL–1 MSiO2 and MSiO2-GO nanosheets. Subsequently, after 24 h, the medium was discarded from each well and then kept for 20 min at 4 °C with 4% paraformaldehyde. The staining of fixed cells was carried out by freshly prepared DAPI for the nucleus and rhodamine phalloidin for the cytoskeleton. Finally, with PBS (pH 7.4), the stained cells were washed two times and then mounted on glass slides. The morphological changes in MSiO2/MSiO2-GO-treated cells were observed through a fluorescence microscope (Nikon Eclipse Ti–S) by viewing glass sides.
2.8. Lead Ion Stock Solution Preparation
The stock solution of lead (Pb2+) ions was prepared by adding 1 g of lead nitrates [Pb(NO3)2] in 1000 mL of distilled water. A drop (1–2) of concentrated nitric acid (HNO3) was added as an analyte to keep the solution fresh.
2.9. Adsorption Experiments
Adsorption studies for Pb2+ ion removal by MSiO2-GO nanosheets were conducted in batch mode. The effect of solution pH on Pb2+ adsorption was examined at varying pH values of 2.0–10.0. The solution pH was adjusted by using 1 M NaOH and HCl. The effects of contact time and NPs dose on Pb2+ sorption at various time intervals (2–30 min) and MSiO2-GO dose (3–20 mg L–1) were characterized. The sorption equilibrium studies were carried out at various temperatures (25, 35, and 45 °C) by dispersing MSiO2-GO nanosheets (15 mg) in 50 mL of varying Pb2+ ion solutions (Pb2+ conc. = 10, 30, 50,80, 100, 120, 150 mg L–1; shaking speed = 200 rpm for 1 h). Then, lead ion-treated water was filtered using Whatman 42 filter paper for the AAS measurement. The amount of Pb2+ adsorbed on MSiO2-GO nanosheets per unit mass was calculated using eq 3. Lead adsorption % was calculated from eq 4
| 3 |
| 4 |
qe is the amount of Pb2+ adsorbed per gram of MSiO2-GO nanosheets (mg g–1), Ci and Ce are the initial and equilibrium concentrations (mg L–1) of Pb2+ in solution, v is the volume (L), w is the weight (g) of the MSiO2-GO nanosheets, and S is the adsorption percentage of Pb2+ ions. The stepwise process of adsorption studies of Pb2+ onto MSiO2-GO nanosheets is illustrated in Figure 2.
Figure 2.

Stepwise process of Pb2+ ion adsorption onto MSiO2-GO nanosheets.
3. Results and Discussion
Figure 3 depicts the XRD patterns of (a) GO sheets; (b) MSiO2 NPs; and (c) MSiO2-GO nanosheets. The XRD pattern of MSiO2 NPs shows a board peak centered at 26.8°, which is attributed to the amorphous nature of silica nanoparticles.19,20 GO sheets show two peaks at 10.6 and 22.9°, which are in conformity with the well-known XRD peak of GO.20 In the case of the composite, MSiO2-GO nanosheets, the peaks at 10.6 and 22.9° (GO sheets) and 26.8° (SiO2 NPs) shifted to 12.4 and 25.4°. The shifted sharp peak at 12.4° corresponds to the presence of GO, while the broad peak around 25.4° is formed due to the intercalation of silica NPs in the GO sheet network.
Figure 3.

XRD patterns of (a) GO sheets; (b) MSiO2 NPs; and (c) MSiO2-GO nanosheets.
TEM images of GO sheets and MSiO2-GO nanosheets are shown in Figure 4a–f. The image (a) clearly shows the excellent formation of transparent single-layered GO sheets with tiny ripples. The images (b–f) depict uniform-sized spherical silica nanoparticles embedded onto the surface of GO layers. The obtained average size for MSiO2 NPs is ∼70 nm. It appears from the images (b–f) that silica NPs are embedded on GO layers via van der Waals forces of attraction between the intermolecular forces of atoms. Image (b) shows a cluster of uniform-sized MSiO2 NPs embedded on the GO sheets. However, image (d) shows two different sizes of dispersed silica NPs embedded in GO sheets. The shrinkage in particle size is due to the trivial ripple of graphene sheets.
Figure 4.

TEM images of different magnifications of (a) single layered GO sheets (1kx) and (b–f) MSiO2-GO nanosheets (b) (8k×); (c) (1k×); (d) (1k×); (e) (5k×); and (f) (2k×).
Figure 5a–c shows the FE-SEM images of the MSiO2-GO nanosheets. From images (a–c), the uniform distribution of silica nanoparticles on the surface of GO sheets is evident. It is also visible that the synthesized silica NPs are highly dispersed.
Figure 5.

FE-SEM images of (a–c) MSiO2-GO nanosheets.
Figure 6 displays the FTIR spectra of GO sheets, MSiO2 NPs, and MSiO2-GO nanosheets. A wideband appears at 3429 cm–1 in all the spectra because of O–H stretching vibration, which is due to the presence of ambient moisture in the compounds [Figure 6a–c]. Due to extensive oxidation, GO sheets have IR peaks at 1720, 1637, and 1104 cm–1, which are attributed to the carboxyl C=O stretching band, O–H deformation vibration band, and C–O stretching vibration, respectively [Figure 6a].9,20 A band appearing at 2927 cm–1 is due to the C–H stretching mode from the carboxylic group. A peak at 1104 cm–1 ascertained in GO responds to the C–O stretching vibration from the alkoxide group and the C–O stretching vibration at 1393 cm–1 corresponds to the carboxyl group.20−22
Figure 6.
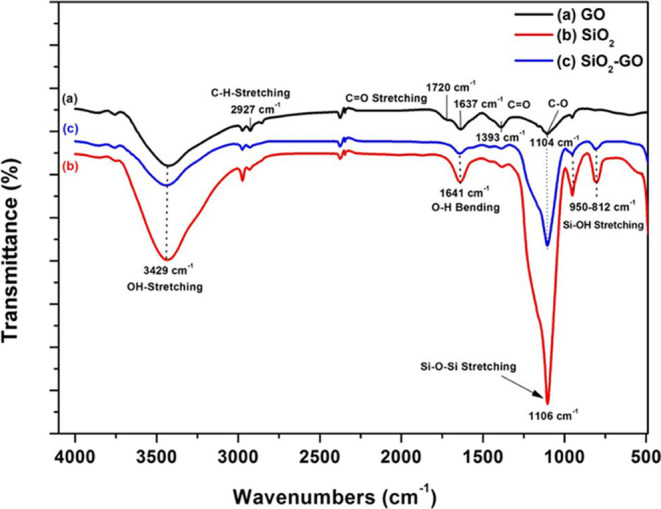
FTIR spectra of (a) GO sheets; (b) MSiO2 NPs; and (c) MSiO2-GO nanosheets.
The IR peaks of silica NPs show three sharp peaks: One at 1106 cm–1, which is due to the antisymmetric stretching vibration of Si–O–Si. The second IR band observed at 950 cm–1 is allotted to the Si–OH stretching vibration.20−22 The third IR band at 812 cm–1 is due to the symmetric stretching vibration of Si–O–Si [Figure 6b].23−25
However, FTIR peak intensity of the composite MSiO2-GO nanosheets of the Si–O–Si band (1104 cm–1) shows significant increases in comparison to GO sheets while decreases as compared to silica NPs, which could be attributed to the reduction of the native oxide [Figure 6a,c]. The peak intensity of other carboxyl groups decreases as compared with GO sheets. Thus, it is an illustration of the successful formation of MSiO2-GO nanosheets. Table 1 illustrates the FT-IR spectra and functional groups of GO sheets, SiO2 NPs, and composite MSiO2-GO nanosheets.
Table 1. FTIR Absorbance Spectra of GO Sheets, MSiO2 NPs, and Composite MSiO2-GO Nanosheets.
| materials | wavenumber (cm–1) | types of functional groups |
|---|---|---|
| GO sheets | 3429 | O–H stretching vibration |
| 2927 | C–H stretching mode of the carboxylic group | |
| 1720 | C=O stretching vibration of the carboxyl group | |
| 1637 | O–H deformation–vibration | |
| 1393 | C–O stretching vibration of the carboxyl group | |
| 1104 | C–O stretching vibration of the alkoxide group | |
| SiO2 | 3429 | O–H stretching vibration |
| 1641 | O–H bending vibration | |
| 1106 | Si–O–Si stretching vibration | |
| 950 | Si–OH stretching vibration | |
| 812 | Si–O–Si bending vibration |
UV–visible
absorbance spectra of MSiO2 NPs, GO
sheets, and MSiO2-GO nanosheets are shown in Figure 7a–c. Bare silica NPs
show an absorption band at 203 nm. Two sharp characteristic absorption
bands appeared at 200.2 and 220.8 nm in the UV–visible spectra
of GO nanosheets [Figure 7b]. The absorption band at 200.2 nm is assigned to  aromatic C–C bond transitions. A
sharp peak at 220.8 nm is attributed to
aromatic C–C bond transitions. A
sharp peak at 220.8 nm is attributed to  transitions of C=O
bonds.8,20,26,27 The absorbance band of the composite MSiO2-GO nanosheets
in the whole spectra increases, which is evident from the red shift
of the absorption peak of GO sheets at 200.2 and 220.8 nm to 206.3
and 272 nm, respectively [Figure 7c].23,25,26 These shifts of bands could be due to the absorption of surface-attaching
MSiO2 NPs.
transitions of C=O
bonds.8,20,26,27 The absorbance band of the composite MSiO2-GO nanosheets
in the whole spectra increases, which is evident from the red shift
of the absorption peak of GO sheets at 200.2 and 220.8 nm to 206.3
and 272 nm, respectively [Figure 7c].23,25,26 These shifts of bands could be due to the absorption of surface-attaching
MSiO2 NPs.
Figure 7.

UV absorbance spectra of (a) MSiO2 NPs; (b) GO sheets; and (c) MSiO2-GO nanosheets.
Furthermore, the red shift of MSiO2-GO nanosheet spectra is due to the close conjugation of MSiO2 NPs and the GO sheets that results in rapid electron transfer and increased transition energy.8,25
Figure 8(i) depicts the obtained surface ζ-potential of GO sheets, MSiO2 NPs, and composite MSiO2-GO nanosheets dispersed in distilled water (neutral pH 7.0). The surface potential of GO sheets was obtained to be −18.5 mV. The profoundly negative ζ-potential of GO sheets is due to the hydroxyl group (−OH–) and the carboxyl group (−COO–) present in GO. The obtained ζ-potential of silica NPs was found to be +32 mV; the positive surface is due to the acidic nature of silica NPs, which enhances the hydronium ions (H+). However, the embedding of SiO2 NPs onto GO sheets makes the surface negatively charged (ζ-potential = −12 mV) due to the presence of GO functional groups −OH– and −COO–, respectively.28,29
Figure 8.

(i) ζ-potential plots of (sample A) GO sheets; (sample B) MSiO2 NPs; and (sample C) MSiO2-GO nanosheets. (ii) Point zero charge (pHpzc) of MSiO2-GO nanosheets.
To obtain the point zero charge (pHpzc) of MSiO2-GO nanosheets, ζ-potential analysis was performed at different pH values varying from 1 to 10 adjusted using 0.01 M NaOH and 0.01 M HCl. The samples were prepared by dispersing a trace amount of NPs in 10 mL of distilled water, followed by agitation for 6 h. Figure 8(ii) shows a typical plot of ζ-potential versus pH value varying from 1 to 10. The obtained ζ-potential charges for pH 1–10 were 0.0 mV (pH 1), −32 mV (pH 2), −40.7 mV (pH 3), −39.1 mV (pH 4), −36.6 mV (pH 5), −43.9 mV (pH 6), −49.7 mV (pH 7), −45 mV (pH 8), −53.5 mV (pH 9), and −49.3 mV (pH 10). The pHpzc value of MSiO2-GO NPs was obtained at an aqueous pH of 1.0 (±0.0 mV). The negative ζ-potential of MSiO2-GO nanosheets is due to the ionization of the carboxyl group (−COO–) present in GO.28,29
3.1. Cytotoxicity Studies
Figure 9a shows the comparative in vitro cytotoxicity studies of MSiO2 NPs and MSiO2-GO nanosheets in relative percentage proliferation/survival of the macrophage normal Raw 264.7 cell line from Murine blood treated with MSiO2/MSiO2-GO nanosheet concentration (5–80 μg mL–1). It is clear from the plot that cell viability remains unaltered in MSiO2/MSiO2-GO nanosheet-treated cells compared with untreated cells.
Figure 9.

(a) MTT assay to determine the cell viability of the Raw 264.7 cells at varying concentrations of MSiO2 and MSiO2-GO nanosheets. (b) Fluorescence microscopy images of Raw 264.7 cells treated with MSiO2 and MSiO2-GO: (i) untreated cells; (ii) 40 μg mL–1 MSiO2 NPs; and (iii) 40 μg mL–1 MSiO2-GO. Images were captured at 40x using a fluorescence microscope (Nikon Eclipse Ti–S).
Figure 9b(ii,iii) shows the fluorescence microscopy images of cells treated with 40 μg mL–1 MSiO2/MSiO2-GO nanosheet concentration incubated for 24 h. The cellular morphology of untreated cells and DAPI-stained nuclei of MSiO2/MSiO2-GO nanosheets treated cells were the same, implying no observable changes in treated cells. Even at a higher dose (40 μg mL–1) of MSiO2/MSiO2-GO nanosheets, the microscopic images show a negligible change in cell morphology. Thus, both MSiO2 NPs and MSiO2-GO nanosheets do not show any adverse effect on cell viability, thereby indicating high biocompatibility of the synthesized MSiO2-GO nanosheets.
BET surface area and pore size distribution of MSiO2 and MSiO2-GO nanosheets were obtained by measuring N2 adsorption and desorption. N2 adsorption studies were conducted by degassing the sample under vacuum at 200 °C for 6 h. Figure 10 shows the N2 adsorption–desorption isotherm curve, which is a typical Type IV isotherm and displays a type H2 hysteresis loop.30 The obtained BET surface areas of MSiO2 NPs and MSiO2-GO nanosheets were 177.597 and 40.239 m2 g–1, respectively. The average pore diameter and pore volume were determined from the distribution (PSD) curve using the Barrett–Joyner–Halenda (BJH) method. The pore diameter was obtained as 30.693–17.726 nm for MSiO2 NPs and 15.282–19.112 Å for MSiO2-GO nanosheets, respectively. The obtained results indicate that both the NPs were mesoporous.30 The total pore volume was obtained as 0.850–0.853 cm3 g–1 for MSiO2 and 0.139–0.126 m2 g–1 for MSiO2-GO. It is clear from comparative Table S1 that the BET surface area, pore volume, and pore size of MSiO2 NPs reduced after being embedded in GO sheets. This is because some pores of MSiO2 NPs are partly enclosed after being assorted with graphene sheets, thereby reducing the pore size, pore volume, and surface area. Similar results were reported earlier in the literature.30,31
Figure 10.

N2 adsorption–desorption isotherm plots of MSiO2 and MSiO2-GO nanosheets.
3.2. Adsorption of Lead Ions at Different Parameters
The comparative lead adsorption studies of bare MSiO2 NPs and GO-MSiO2 nanosheets were performed using 15 mg L–1 NP dose dissolved in 50 mg L–1 Pb solution at optimal parameters (temp.: 25 °C; shaking speed: 200 rpm; pH: 6.0). It is clear from Figure 11 that both the nanosorbents successfully adsorbed Pb2+ ions from water. The removal efficiency of Pb2+ ions using the adsorbent GO-MSiO2 is significantly higher compared with bare MSiO2 NPs. About 90.4% of Pb2+ ions were adsorbed using GO-MSiO2, and 71.5% were adsorbed using bare MSiO2 NPs. The better adsorption of lead ions using GO-MSiO2 is due to the graphene sheet’s excellent properties, such as large surface area, high mobility of charge carriers, and chemical stability. Furthermore, GO sheets contain several functional groups, such as hydroxyl (−OH), carboxyl (−COOH), and epoxy groups (–C=O). These functional groups enhance the excellent adsorption sites for Pb2+ ions in water. Thus, GO-MSiO2 nanosheets have been used as sorbents for the rest of the adsorption parameters.
Figure 11.

Comparative lead adsorption using nanosorbent MSiO2-GO nanosheets (sample A) and MSiO2 NPs (sample B).
3.2.1. Effect of the Nanosorbent Dose
To find out the optimal dose of MSiO2-GO nanosheets on adsorption of Pb2+ ions, the experiment was conducted at various adsorbent doses (3, 5, 10, 15, 20 mg L–1) in 50 ppm Pb2+ ions with certain optimum conditions (temperature: 25 °C; equilibrium time: 60 min; shaking speed: 200 rpm). Figure 12 shows the effects of Pb2+ absorption with various doses of MSiO2-GO nanosheets. It could be understood from the plots that the removal efficiency of Pb2+ ions significantly increases with the increase in the doses of the MSiO2-GO nanosheets. About 25–90% lead removal was obtained at the dose of 3–20 mg L–1. This is because the increase in adsorbent doses increases the available adsorption sites, which leads to more binding of Pb2+ ions.1,2,32 The maximum removal condition of Pb2+ ions has been obtained at an adsorbent dose of 15 mg L–1, and after that, not much further removal occurred. Hence, a 15 mg L–1 dose of MSiO2-GO nanosheets was taken in all the adsorption studies.
Figure 12.

Effect of MSiO2-GO nanosheet doses on adsorption of Pb2+ ions.
3.2.2. Effect of the Aqueous pH
The aqueous pH determines the effects of adsorbent surface charge, the degree of ionization, its functional groups, and the solubility of metal ions during the reaction between the adsorbent and adsorbate.1,32 To analyze the effect of solution pH on the adsorption of Pb2+ ions onto the MSiO2-GO nanosheet surface, 15 mg L–1 adsorbent was added into 50 mL containing Pb2+ (50 mg L–1) with adjusted pH (2.0–10.0). NaOH and HCl solutions set the aqueous pH. The consequences of aqueous pH on Pb2+ ion adsorption in a pH range from 2.0 to 10.0 are shown in Figure 13. Lead ions start precipitating from solution pH > 7.0. It is clear from the plot that at pH 2.0–3.0, the removal efficiency of the Pb2+ ion is almost unnoticed; however, the adsorption of Pb2+ increases rapidly as the solution pH rises from 4.0 to 7.0 due to an increase in the negative ζ-potential of MSiO2-GO from −39.1 to −49.7 mV as shown in Figure 8(ii). This is due to less competition of active sites between hydrogen ions versus Pb2+ ions, which results from the negative surface charge of GO nanosheets obtained from −OH and −COOH functional groups, thereby resulting in more electrostatic attractions of Pb2+ ions and negative surface (−OH and −COOH) of MSiO2-GO nanosheets.33,34
Figure 13.

Effect of aqueous pH on the adsorption of Pb2+ ions onto MSiO2-GO nanosheets.
At basic pH, lead ions are positively charged species Pb2+ and Pb(OH)+.26,34 Therefore, the significant increase of Pb2+ adsorption at aqueous pH 3.0–7.0 is due to electrostatic attraction of highly negative surface charge of MSiO2-GO nanosheets and positive species Pb2+ and Pb(OH)+ ions.26,33 The functional groups of GO such as −OH and −COO– are progressively deprotonated when the pH increases.
At low solution pH (2.0–3.0), the adsorption of Pb2+ ions is low due to the competition between Pb2+ ions and hydrogen ions (H+), resulting in a repulsion of both ions.26,33 Furthermore, at low pH, MSiO2-GO nanosheet surfaces have a high positive charge that leads to electrostatic repulsion with Pb2+ ions, which results in a low adsorption. The probable reaction mechanism of Pb2+ ion sorption onto MSiO2-GO nanosheets is shown in Figure 14.
Figure 14.

Possible reaction mechanism of Pb2+ ion sorption onto MSiO2-GO nanosheets.
3.2.3. Effect of the Time Interval and Adsorption Kinetics
To monitor the consequence of interaction time on the adsorption of Pb2+ onto MSiO2-GO nanosheets, the studies were conducted at diverse time intervals between 2 and 30 min at optimum conditions (pH: 6; MSiO2-GO dose: 15 mg L–1; Pb2+ ions conc.: 50 mg L–1; temp.: 25 °C; shaking speed: 200 rpm). It is evident from Figure 15 that the adsorption efficiency of Pb2+ ions increases from 30 to 98% with the rise of the interaction time interval from 2 to 30 min.1,26 About 75% of Pb2+ ion uptake occurs within 10 min, and 98% occurs within 25 min. In both cases, the adsorption rate at the beginning is fast and then slows down as the equilibrium is achieved. The adsorption equilibrium for both Pb2+ adsorptions was achieved in nearly 25–30 min. The sorption kinetic pseudo-first- and pseudo-second-order models were applied to investigate the absorption mechanism between Pb2+ ions and MSiO2-GO nanosheets, including chemical reaction, mass transfer, and potential of rate control. Equations 5 and 6 describe the linear expressions of pseudo-first- and pseudo-second-order kinetic rates.
| 5 |
| 6 |
k1 and k2 (min–1) are the adsorption first-order and second-order rate constants, respectively, and qe, and qt (mg g–1) are the amounts of Pb2+ adsorbed at equilibrium and at time t, respectively.
Figure 15.

Effect of the time interval on the adsorption of lead onto MSiO2-GO nanosheets.
Figure 16a,b shows the pseudo-first- and pseudo-second-order kinetic plots examined for Pb2+ adsorption by MSiO2-GO nanosheets. The equilibrium adsorption amount for Pb2+ is calculated using eqs 5 and 6. The obtained Pb2+ adsorption qe onto MSiO2-GO nanosheets for pseudo-first and pseudo-second order is 72.276 and 111.12 mg g–1, respectively. The determination coefficient factor (R2) and kinetic rate constants (k1 and k2) have been calculated from the graphical plot intercepts and slopes.
Figure 16.

(a) Pseudo-first-order kinetic plot on adsorption of Pb2+ onto MSiO2-GO nanosheets. (b) Pseudo-second-order kinetic plot on adsorption of Pb2+ onto MSiO2-GO nanosheets.
The calculated kinetic parameters are presented in Table 2. The acquired values of R12 from pseudo-first-order and R22 pseudo-second-order for Pb2+ sorption are 0.982 and 0.983, respectively, which are almost the same. The adsorption data of Pb2+ ions are fitted well with both pseudo-first- and pseudo-second-order kinetic models, indicating adsorption of Pb2+ onto the MSiO2-GO surface to be chemisorption as well as physisorption. Related remarks have been reported earlier.26
Table 2. Kinetic Model Parameters of Pb2+ Adsorption on MSiO2-GO Nanosheets.
| parameters | pseudo-first-order | pseudo-second-order |
|---|---|---|
| slope (m) | –0.037 | 0.009 |
| K | 0.436 | 0.001 |
| intercept (c) | 1.859 | 0.062 |
| qe (mg g–1) | 72.27 | 111.12 |
| R2 | 0.982 | 0.983 |
3.3. Lead Adsorption Isotherms
The adsorption isotherm models Langmuir and Freundlich have been used to better understand the adsorption mechanism of Pb2+ ion and MSiO2-GO nanosheet interaction. The Langmuir isotherm states monolayer adsorption of metal ions on the surface of the adsorbent with uniform energy. However, the Freundlich isotherm suggested the multilayer sorption of metal ions on the adsorbent surface via the nonuniform distribution of energy. The value of “1/n” represents the degree of nonlinearity between adsorption and solution concentration. Adsorption is linear when n = 1, chemical adsorption when n < 1, and physical adsorption when n > 1.
Similarly, RL is the Langmuir adsorption isotherm parameter, which can be obtained using a dimensionless constant called the separation factor or equilibrium parameter by eq 7
| 7 |
where Ci stands for the initial concentration and b stands for the Langmuir constant. Adsorption should be irreversible when RL = 0, linear when RL = 1, unfavorable when RL > 1, and favorable adsorption when 0 < RL < 1.
The isotherm models Langmuir and Freundlich for Pb2+ sorption on MSiO2-GO nanosheets at different temperatures (25–45 °C) are shown in Figures 17 and 18. The obtained Langmuir correlation values (R2) for the adsorption of Pb2+ at different temperatures (25, 35, and 45 °C) are 0.912, 0.305, and 0.989, respectively. The Freundlich correlation values (R2) are found to be 0.869, 0.856, and 0.833, respectively. The obtained Langmuir and Freundlich adsorption parameters are listed in Table 3. The Langmuir correlation factor “R2” is found to be better than the value of the Freundlich model, indicating the monolayer adsorption of Pb2+ on MSiO2-GO nanosheets. The Langmuir separation factor “RL” for Pb2+ adsorption obtained is in the range of 0.1–0.9 [Figure 19]. In the present study, RL > 0 indicates favorable adsorption of Pb2+ on MSiO2-GO. The compared adsorption of Pb2+ on MSiO2-GO nanosheets versus other nanosorbents is listed in Table S2.6,21,35−41
Figure 17.

Langmuir isotherm plots on Pb2+ adsorption onto MSiO2-GO nanosheets with varied temperatures (25–45 °C).
Figure 18.

Freundlich isotherm plots on Pb2+ adsorption onto MSiO2-GO nanosheets at varied temperatures (25–45 °C).
Table 3. Langmuir and Freundlich Isotherms Parameters.
| isotherm plots | temperature (°C) | m (slope) | qmax (mg g–1) | c (intercept) | b | R2 |
|---|---|---|---|---|---|---|
| Langmuir | 25 | 0.068 | 14.706 | 0.867 | 0.078 | 0.912 |
| 35 | 0.054 | 18.518 | 3.489 | 0.015 | 0.305 | |
| 45 | 0.099 | 10.101 | 0.793 | 0.124 | 0.989 |
| isotherm plots | temperature (°C) | m (slope) | n | c (intercept) | KF | R2 |
|---|---|---|---|---|---|---|
| Freundlich | 25 | 0.266 | 3.75 | 0.584 | 3.83 | 0.869 |
| 35 | 0.561 | 1.78 | –0.052 | 1.12 | 0.856 | |
| 45 | 0.293 | 3.41 | 0.406 | 2.54 | 0.833 |
Figure 19.

Langmuir separation factor (RL) for Pb2+ adsorption onto MSiO2-GO nanosheets at various temperatures (25–45 °C).
3.4. Confirmation of the Support of Pb2+ Adsorbed on MSiO2-GO Nanosheets
Figure 20a,b displays the SEM/EDX spectra of MSiO2-GO nanosheets and Pb2+-loaded MSiO2-GO, respectively. MSiO2-GO nanosheets show distinctively visible spectra of elements such as silicon (34.68%), oxygen (61.11%), and carbon (4.21%) [Figure 20a]. Distinctly visible spectra of lead are shown in Figure 20b. This shows the elemental composition of lead (0.21%), thus confirming the adsorption of Pb2+ on the surface of MSiO2-GO nanosheets.
Figure 20.

EDX spectra of (a) MSiO2-GO nanosheets and (b) lead uptake MSiO2-GO nanosheets.
SEM elemental mapping analysis confirms the spatial distribution and elemental composition of lead onto MSiO2-GO nanosheets, which illustrates the elements silica in red, oxygen in green, and carbon in royal blue [Figure 21a,b]. Image (c) visibly reveals a homogenous distribution of lead loaded on the surface of MSiO2-GO nanosheets, which shows the composition of lead in yellow color.
Figure 21.

SEM-EDX mapping of (a) MSiO2 NPs; (b) MSiO2-GO nanosheets; and (c) lead uptake MSiO2-GO nanosheets.
3.5. Regeneration Studies of Exhausted MSiO2-GO Nanosheets
The regeneration of exhausted MSiO2-GO nanosheets was carried out by using 0.005 M HNO3 as the desorbing agent. Initially, 0.1 g L–1 MSiO2-GO was agitated with 50 mg L–1 Pb2+ solution for 60 min at 200 rpm shaking speed. The spent MSiO2-GO was separated after Pb2+ adsorption and desorbed by using 0.005 M HNO3 for five cycles. Figure 22 shows the regeneration plot for the MSiO2-GO nanosheets. In the first aliquots (20 mL each), about 87% of the total recovered lead was desorbed, and the rest was desorbed in four increments of 20 mL of 0.005 M HNO3.
Figure 22.

Regeneration of exhausted MSiO2-GO nanosheets using 0.005 M HNO3 as a desorbing agent.
4. Conclusions
Mesoporous silica-embedded graphene oxide (MSiO2-GO) nanosheets were synthesized and characterized. MSiO2 NPs embedded in the GO layer successfully decreased the folding nature of GO sheets as shown in TEM images, thereby increasing its mechanical strength. The comparative cytotoxicity studies of MSiO2 NPs and MSiO2-GO nanosheets reveal no change in cell morphology even at a high dose of NPs, thus showing excellent biocompatibility. About 90% of Pb2+ ions were detached from water within 30 min at solution pH 6.0. Sorption dynamic data agreed well with pseudo-first- and pseudo-second-order kinetic models, which indicates both physisorptions as well as chemisorptions and controlled adsorption of Pb2+ ions. The Langmuir isotherm models agreed well with sorption equilibrium data, which confirms the monolayer adsorption of Pb2+ on MSiO2-GO nanosheets. The regeneration of the exhausted MSiO2-GO nanosheets was successfully demonstrated. Thus, the synthesized MSiO2-GO nanosheets can be considered simple, economical, biocompatible, and reusable adsorbents for the excellent removal of Pb2+ ions from water.
Acknowledgments
This research work is supported by R&D sanctioned no. PHED/JJM/158/2021-22/483 funded by Jal Jeevan Mission (JJM), Itanagar, under the head account “Water Quality Monitoring & Surveillance” and subcomponent “Any Other Innovation” and a grant received from the Department of Science and Technology, Government of India (DST purse), and the UGC (UPE-II; Project 58). The authors are thankful to the USIC at the University of Delhi, AIRF at Jawaharlal Nehru University, New Delhi, for providing the facilities for BET, HRTEM, SEM, and FT-IR characterizations. The authors are also grateful to the central instrumentation facility (CIF), SES JNU, New Delhi, for providing the AAS facility.
Supporting Information Available
The Supporting Information is available free of charge at https://pubs.acs.org/doi/10.1021/acsomega.3c05228.
BET surface area, pore volume and pore size distribution of the synthesized MSiO2 NPs and MSiO2-GO nanosheets obtained by measuring N2 adsorption and desorption plot and comparative adsorption of Pb2+ ions onto MSiO2-GO nanosheets with other reported nanosorbents (PDF)
The authors declare no competing financial interest.
Supplementary Material
References
- Gao W.; Majumder M.; Alemany L. B.; Narayanan T. N.; Ibarra M. A.; Pradhan B. K.; Ajayan P. M. Engineered graphite oxide materials for application in water purification. ACS Appl. Mater. Interfaces 2011, 3 (6), 1821–1826. 10.1021/am200300u. [DOI] [PubMed] [Google Scholar]
- Madadrang C. J.; Kim H. Y.; Gao G.; Wang N.; Zhu J.; Feng H.; Gorring M.; Kasner M. L.; Hou S. Adsorption behavior of EDTA-graphene oxide for Pb (II) removal. ACS Appl. Mater. Interfaces 2012, 4 (3), 1186–1193. 10.1021/am201645g. [DOI] [PubMed] [Google Scholar]
- Nagajyoti P. C.; Lee K. D.; Sreekanth T. Heavy metals, occurrence and toxicity for plants: a review. Environ. Chem. Lett. 2010, 8, 199–216. 10.1007/s10311-010-0297-8. [DOI] [Google Scholar]
- Toxicological Profile for Lead US EPA. Air Quality Criteria for Lead US Department of Health and Human Services, Agency for Toxic Substances and Disease Registry (ATSDR), Public Health Service: Atlanta, GA; 2007.
- Järup L. Hazards of heavy metal contamination. Br. Med. Bull. 2003, 68 (1), 167–182. 10.1093/bmb/ldg032. [DOI] [PubMed] [Google Scholar]
- Bagbi Y.; Sarswat A.; Mohan D.; Pandey A.; Solanki P. R. Lead and chromium adsorption from water using L-cysteine functionalized magnetite (Fe3O4) nanoparticles. Sci. Rep. 2017, 7 (1), 7672 10.1038/s41598-017-03380-x. [DOI] [PMC free article] [PubMed] [Google Scholar]
- Bagbi Y.; Sarswat A.; Mohan D.; Pandey A.; Solanki P. R. Lead (Pb2+) adsorption by monodispersed magnetite nanoparticles: Surface analysis and effects of solution chemistry. J. Environ. Chem. Eng. 2016, 4 (4), 4237–4247. 10.1016/j.jece.2016.09.026. [DOI] [Google Scholar]
- Yang H.; Xu R.; Xue X.; Li F.; Li G. Hybrid surfactant-templated mesoporous silica formed in ethanol and its application for heavy metal removal. J. Hazard. Mater. 2008, 152 (2), 690–698. 10.1016/j.jhazmat.2007.07.060. [DOI] [PubMed] [Google Scholar]
- Sreeprasad T. S.; Maliyekkal S. M.; Lisha K. P.; Pradeep T. Reduced graphene oxide–metal/metal oxide composites: facile synthesis and application in water purification. J. Hazard. Mater. 2011, 186 (1), 921–931. 10.1016/j.jhazmat.2010.11.100. [DOI] [PubMed] [Google Scholar]
- Geim A. K. Graphene: status and prospects. Science 2009, 324 (5934), 1530–1534. 10.1126/science.1158877. [DOI] [PubMed] [Google Scholar]
- Yu J.-G.; Yu L.-Y.; Yang H.; Liu Q.; Chen X.-H.; Jiang X.-Y.; Chen X.-Q.; Jiao F.-P. Graphene nanosheets as novel adsorbents in adsorption, preconcentration and removal of gases, organic compounds and metal ions. Sci. Total Environ. 2015, 502, 70–79. 10.1016/j.scitotenv.2014.08.077. [DOI] [PubMed] [Google Scholar]
- Lü K.; Zhao G.; Wang X. A brief review of graphene-based material synthesis and its application in environmental pollution management. Chin. Sci. Bull. 2012, 57, 1223–1234. 10.1007/s11434-012-4986-5. [DOI] [Google Scholar]
- Zhao G.; Ren X.; Gao X.; Tan X.; Li J.; Chen C.; Huang Y.; Wang X. Removal of Pb (II) ions from aqueous solutions on few-layered graphene oxide nanosheets. Dalton Trans. 2011, 40 (41), 10945–10952. 10.1039/c1dt11005e. [DOI] [PubMed] [Google Scholar]
- Ma Y.; Di H.; Yu Z.; Liang L.; Lv L.; Pan Y.; Zhang Y.; Yin D. Fabrication of silica-decorated graphene oxide nanohybrids and the properties of composite epoxy coatings research. Appl. Surf. Sci. 2016, 360, 936–945. 10.1016/j.apsusc.2015.11.088. [DOI] [Google Scholar]
- Yang K.; Chen B.; Zhu L. Graphene-coated materials using silica particles as a framework for highly efficient removal of aromatic pollutants in water. Sci. Rep. 2015, 5 (1), 11641 10.1038/srep11641. [DOI] [PMC free article] [PubMed] [Google Scholar]
- Sardoiwala M. N.; Kaundal B.; Choudhury S. R. Toxic impact of nanomaterials on microbes, plants and animals. Environ. Chem. Lett. 2018, 16, 147–160. 10.1007/s10311-017-0672-9. [DOI] [Google Scholar]
- Bhowmik K.; Pramanik S.; Medda S. K.; De G. Covalently functionalized reduced graphene oxide by organically modified silica: a facile synthesis of electrically conducting black coatings on glass. J. Mater. Chem. 2012, 22 (47), 24690–24697. 10.1039/c2jm35429b. [DOI] [Google Scholar]
- Bagbi Y.; Pandey A.; Solanki P. R. Mesoporous Spherical Shaped Silica Nanoparticles for the Effective Adsorption of Aqueous Lead (Pb2+). Adv. Sci. Lett. 2018, 24 (2), 922–926. 10.1166/asl.2018.10874. [DOI] [Google Scholar]
- Dakshinamoorthy P.; Vaithilingam S. Platinum–copper doped poly (sulfonyldiphenol/cyclophosphazene/benzidine)–graphene oxide composite as an electrode material for single stack direct alcohol alkaline fuel cells. RSC Adv. 2017, 7 (56), 34922–34932. 10.1039/C7RA04525E. [DOI] [Google Scholar]
- Zhang W.-H.; He P.-P.; Wu S.; Xu J.; Li Y.; Zhang G.; Wei X.-Y. Graphene oxide grafted hydroxyl-functionalized ionic liquid: A highly efficient catalyst for cycloaddition of CO2 with epoxides. Appl. Catal., A 2016, 509, 111–117. 10.1016/j.apcata.2015.10.038. [DOI] [Google Scholar]
- Chaudhary Y. S.; Ghatak J.; Bhatta U. M.; Khushalani D. One-step method for the self-assembly of metal nanoparticles onto facetted hollow silica tubes. J. Mater. Chem. 2006, 16 (36), 3619–3623. 10.1039/b608460e. [DOI] [Google Scholar]
- Nakamoto K.Infrared and Raman Spectra of Inorganic and Coordination Compounds, Part B: Applications in Coordination, Organometallic, and Bioinorganic Chemistry; John Wiley & Sons, 2009. [Google Scholar]
- Abraham S.; Ciobota V.; Srivastava S.; Srivastava S. K.; Singh R. K.; Dellith J.; Malhotra B.; Schmitt M.; Popp J.; Srivastava A. Mesoporous silica particle embedded functional graphene oxide as an efficient platform for urea biosensing. Anal. Methods 2014, 6 (17), 6711–6720. 10.1039/C4AY01303D. [DOI] [Google Scholar]
- Kirk C. T. Quantitative analysis of the effect of disorder-induced mode coupling on infrared absorption in silica. Phys. Rev. B 1988, 38 (2), 1255. 10.1103/PhysRevB.38.1255. [DOI] [PubMed] [Google Scholar]
- Zhong L.; Yun K. Graphene oxide-modified ZnO particles: synthesis, characterization, and antibacterial properties. Int. J. Nanomed. 2015, 10, 79–92. 10.2147/IJN.S88319. [DOI] [PMC free article] [PubMed] [Google Scholar]
- Hao L.; Song H.; Zhang L.; Wan X.; Tang Y.; Lv Y. SiO2/graphene composite for highly selective adsorption of Pb (II) ion. J. Colloid Interface Sci. 2012, 369 (1), 381–387. 10.1016/j.jcis.2011.12.023. [DOI] [PubMed] [Google Scholar]
- Huang P.; Xu C.; Lin J.; Wang C.; Wang X.; Zhang C.; Zhou X.; Guo S.; Cui D. Folic acid-conjugated graphene oxide loaded with photosensitizers for targeting photodynamic therapy. Theranostics 2011, 1, 240. 10.7150/thno/v01p0240. [DOI] [PMC free article] [PubMed] [Google Scholar]
- Xu G.; Zhang J.; Song G. Effect of complexation on the zeta potential of silica powder. Powder Technol. 2003, 134 (3), 218–222. 10.1016/S0032-5910(03)00172-4. [DOI] [Google Scholar]
- Wang Z. M.; Wang W.; Coombs N.; Soheilnia N.; Ozin G. A. Graphene oxide– periodic mesoporous silica sandwich nanocomposites with vertically oriented channels. ACS Nano 2010, 4 (12), 7437–7450. 10.1021/nn102618n. [DOI] [PubMed] [Google Scholar]
- Du Y. C.; Huang L. J.; Wang Y. X.; Yang K.; Zhang Z. J.; Wang Y.; Kipper M. J.; Belfiore L. A.; Tang J. G. Preparation of graphene oxide/silica hybrid composite membranes and performance studies in water treatment. J. Mater. Sci. 2020, 55, 11188–11202. 10.1007/s10853-020-04774-5. [DOI] [Google Scholar]
- Peng J.; Li W.; Wu Z.; Li H.; Huang Y.; Ouyang Y.; Wang Y.; Guo X.; Chen G.; Wang X. Rational design and performance of ansode materials based on Si/SiO x/C particles anchored on graphene sheets. ACS Appl. Energy Mater. 2021, 4 (5), 4966–4975. 10.1021/acsaem.1c00523. [DOI] [Google Scholar]
- Rajput S.; Pittman C. U. Jr.; Mohan D. Magnetic magnetite (Fe3O4) nanoparticle synthesis and applications for lead (Pb2+) and chromium (Cr6+) removal from water. J. Colloid Interface Sci. 2016, 468, 334–346. 10.1016/j.jcis.2015.12.008. [DOI] [PubMed] [Google Scholar]
- Chen A.-H.; Liu S.-C.; Chen C.-Y.; Chen C.-Y. Comparative adsorption of Cu (II), Zn (II), and Pb (II) ions in aqueous solution on the crosslinked chitosan with epichlorohydrin. J. Hazard. Mater. 2008, 154 (1–3), 184–191. 10.1016/j.jhazmat.2007.10.009. [DOI] [PubMed] [Google Scholar]
- Chen C.; Wang X. Adsorption of Ni (II) from aqueous solution using oxidized multiwall carbon nanotubes. Ind. Eng. Chem. Res. 2006, 45 (26), 9144–9149. 10.1021/ie060791z. [DOI] [Google Scholar]
- Kumari M.; Pittman C. U. Jr.; Mohan D. Heavy metals [chromium (VI) and lead (II)] removal from water using mesoporous magnetite (Fe3O4) nanospheres. J. Colloid Interface Sci. 2015, 442, 120–132. 10.1016/j.jcis.2014.09.012. [DOI] [PubMed] [Google Scholar]
- Liu R.; Liang P. Determination of trace lead in water samples by graphite furnace atomic absorption spectrometry after preconcentration with nanometer titanium dioxide immobilized on silica gel. J. Hazard. Mater. 2008, 152 (1), 166–171. 10.1016/j.jhazmat.2007.06.081. [DOI] [PubMed] [Google Scholar]
- Cao C.-Y.; Cui Z.-M.; Chen C.-Q.; Song W.-G.; Cai W. Ceria hollow nanospheres produced by a template-free microwave-assisted hydrothermal method for heavy metal ion removal and catalysis. J. Phys. Chem. C 2010, 114 (21), 9865–9870. 10.1021/jp101553x. [DOI] [Google Scholar]
- Mahdavi M.; Ahmad M. B.; Haron M. J.; Gharayebi Y.; Shameli K.; Nadi B. Fabrication and characterization of SiO 2/(3-aminopropyl) triethoxysilane-coated magnetite nanoparticles for lead (II) removal from aqueous solution. J. Inorg. Organomet. Polym. Mater. 2013, 23, 599–607. 10.1007/s10904-013-9820-2. [DOI] [Google Scholar]
- Ma X.; Wang Y.; Gao M.; Xu H.; Li G. A novel strategy to prepare ZnO/PbS heterostructured functional nanocomposite utilizing the surface adsorption property of ZnO nanosheets. Catal. Today 2010, 158 (3–4), 459–463. 10.1016/j.cattod.2010.07.013. [DOI] [Google Scholar]
- Zhong L. S.; Hu J. S.; Liang H. P.; Cao A. M.; Song W. G.; Wan L. J. Self-Assembled 3D flowerlike iron oxide nanostructures and their application in water treatment. Adv. Mater. 2006, 18 (18), 2426–2431. 10.1002/adma.200600504. [DOI] [Google Scholar]
- Huang S.-H.; Chen D.-H. Rapid removal of heavy metal cations and anions from aqueous solutions by an amino-functionalized magnetic nano-adsorbent. J. Hazard. Mater. 2009, 163 (1), 174–179. 10.1016/j.jhazmat.2008.06.075. [DOI] [PubMed] [Google Scholar]
Associated Data
This section collects any data citations, data availability statements, or supplementary materials included in this article.