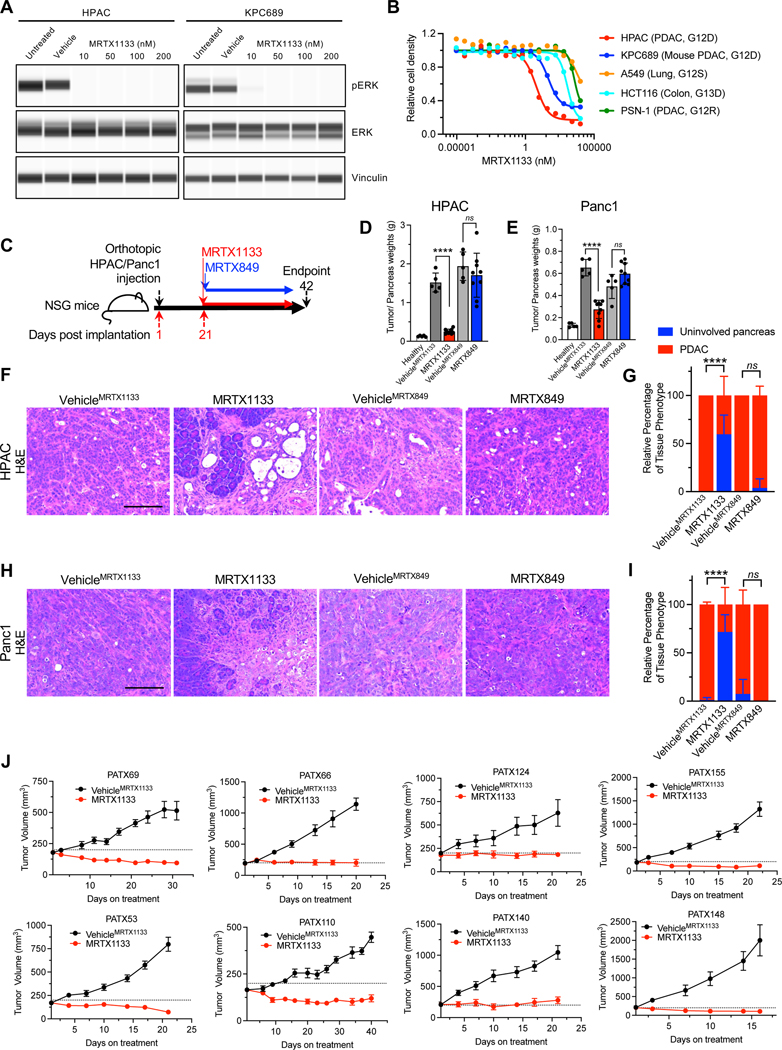
Figure 1: KRAS* inhibition controls the growth of human cell lines and PDXs.
(A) Capillary immunoassay for pERK and vinculin abundance in HPAC and KPC689 cells in response to MRTX1133. Vehicle: DMSO. (B) Cell proliferation in response to MRTX1133. Cell lines and tissue of origin, and mutational status of KRAS/Kras are listed in parentheses (n=3 biological replicates/group). (C) Schematic of orthotopic experiments in NSG mice with HPAC and Panc1. Treatment started at day 21, and mice were euthanized at day 42. (D-E) Tumor/pancreas weights at endpoint for orthotopic HPAC (Healthy: n=5, VehicleMRTX1133: n=5, MRTX1133: n=9, VehicleMRTX849: n=5, MRTX849: n=9) (D) and Panc1 (Healthy: n=5, VehicleMRTX1133: n=5, MRTX1133: n=9, VehicleMRTX849: n=5, MRTX849: n=9) (E). The same pancreas weights for healthy are presented in both (D) and (E). (F-I) Histological analyses of orthotopic HPAC (VehicleMRTX1133: n=4, MRTX1133: n=5, VehicleMRTX849: n=4, MRTX849: n=6) and Panc1 (VehicleMRTX1133: n=5, MRTX1133: n=4, VehicleMRTX849: n=4, MRTX849: n=5) tumors. (F) Representative H&E images of orthotopic HPAC tumors with the indicated treatments. (G) Histological scoring of orthotopic HPAC tumors. (H) Representative H&E images of orthotopic Panc1 tumors with the indicated treatments. (I) Histological scoring of orthotopic Panc1 tumors. (J) Tumor growth curves of PDXs implanted subcutaneously into athymic nude mice. PATX148: n=5 mice per group; PATX140: VehicleMRTX1133 n=6 mice per group, MRTX1133 n=5 mice per group; PATX124: n=6 mice per group; PATX155: n=6 mice per group; PATX110: n=6 mice per group; PATX53: VehicleMRTX1133 n=5 mice per group, MRTX1133 n=6 mice per group; PATX66: n=6 mice per group; PATX69: n=6 mice per group. In D, E, G, I and J data are presented as mean ± SD. Significance was determined by unpaired t-test in D, E and by two-way ANOVA with Tukey’s multiple comparisons test in G and I. **** P<0.0001, ns: not significant. Scale bars: 100 μm.
See also figures S1–S3.

