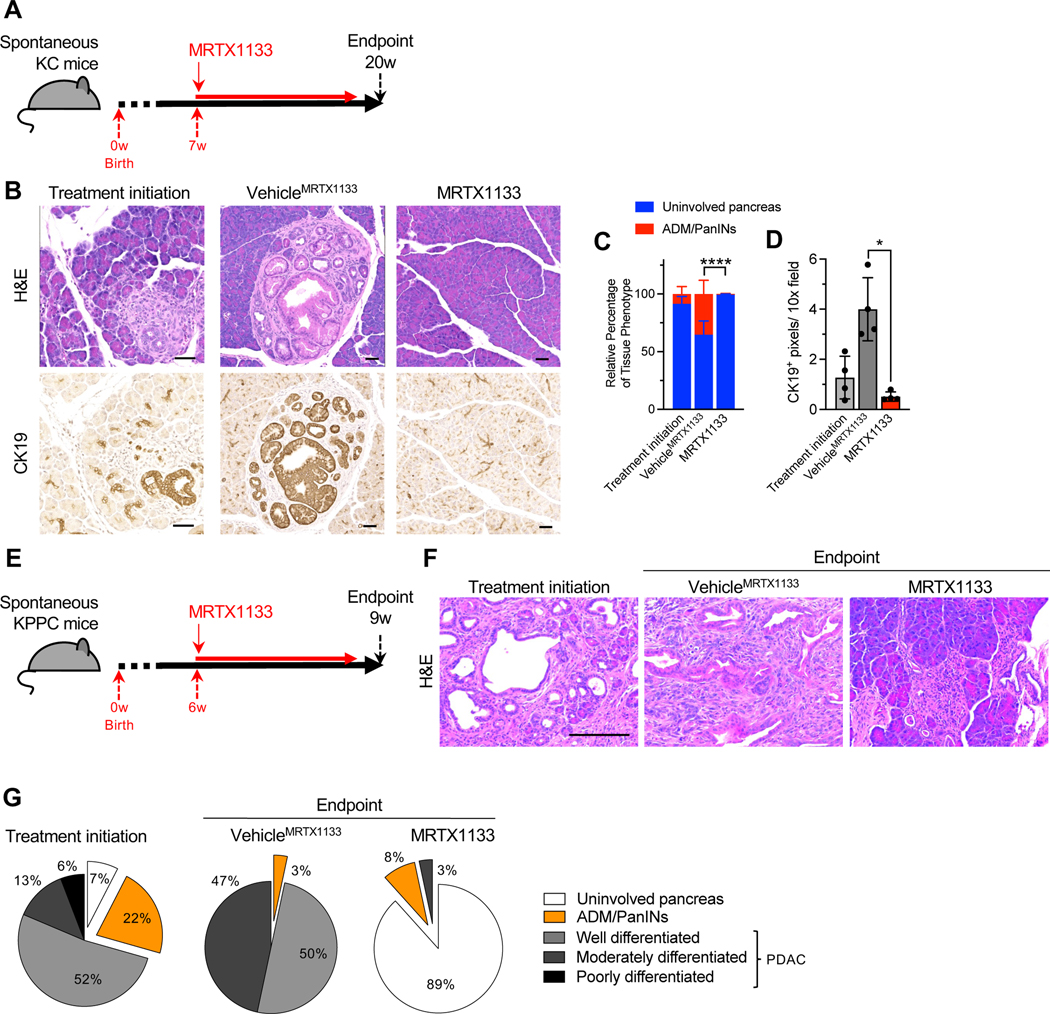
Figure 3: KRAS* inhibition reverses precancerous and established cancerous lesions.
(A) Schematic of spontaneous KC treatment experiments. Treatment was initiated at 7 weeks and mice euthanized at 20 weeks post-birth. (B-D) Representative H&E and CK19 immunostaining images of the pancreata of KC mice (B) and histological (Treatment initiation: n=4, VehicleMRTX1133: n=4 and MRTX1133: n=4) and CK19 immunostaining quantification (n=4 per group) (C-D). ADM: acinar to ductal metaplasia. (E) Schematic of spontaneous KPPC treatment experiments. Treatment was initiated at 6 weeks and mice euthanized at 9 weeks post-birth. (F-G) Representative H&E images of the pancreata of KPPC mice (F) and quantification (Treatment initiation: n=4, VehicleMRTX1133: n=1 and MRTX1133: n=1) (G). In C and D, data are presented as mean ± SD. Significance was determined by two-way ANOVA with Sidak’s multiple comparisons test in C and by Welch’s t-test in D. Scale bars: 100 μm. ** P<0.01, **** P<0.0001.
See also Figure S4.

