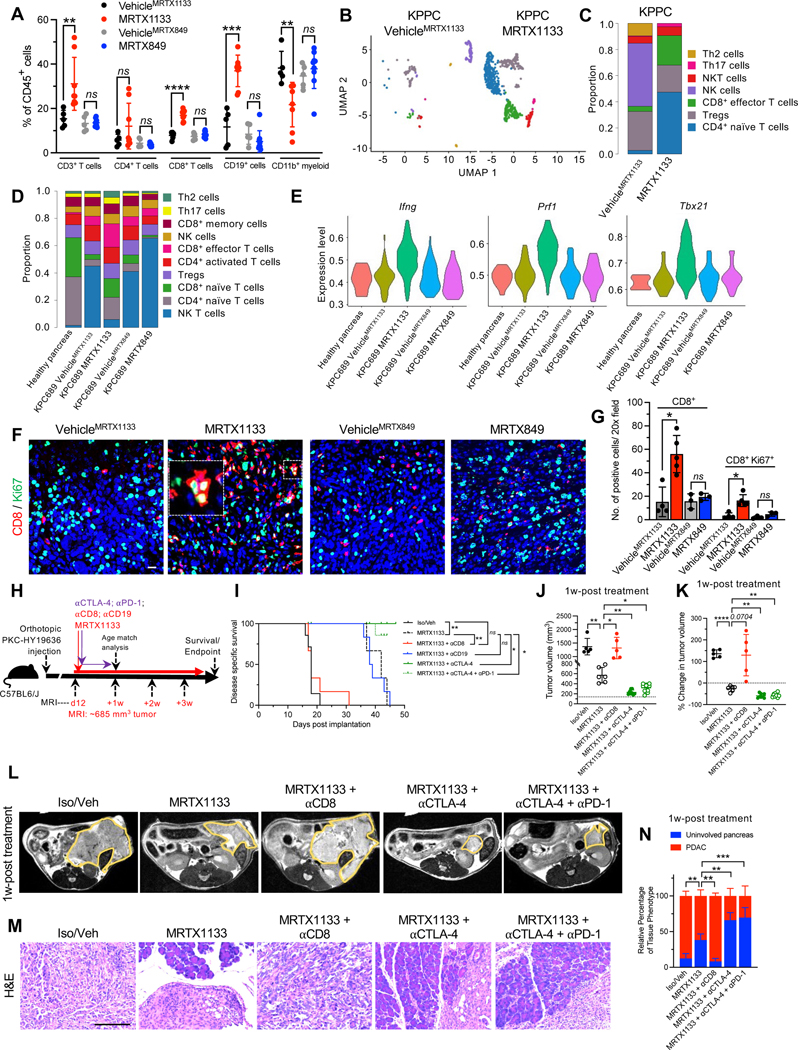
Figure 5: The efficacy of KRAS* inhibition is dependent on CD8+ T cells.
(A) Immunotyping by flow cytometry of orthotopic KPC689 tumors in C57BL6/J mice (VehicleMRTX1133: n=5, MRTX1133: n=8, VehicleMRTX849: n=5, MRTX849: n=9). (B-C) UMAPs and relative abundance of T cell subsets (C) of spontaneous KPPC tumors determined by scRNA-seq. (D) Relative abundance of T cell subsets of orthotopic KPC689 tumors in C57BL6/J mice determined by scRNA-seq. (E) Violin plots for Ifng, Prf1, and Txb21 expression in tumor infiltrating CD8+ effector T cells in orthotopic KPC689 C57BL6/J mice determined by scRNA-seq. (F-G) Representative immunofluorescent images (F) and quantification (G) of CD8+ and Ki67+ T cells in orthotopic KPC689 tumors in C57BL6/J mice. Scale bar: 25 μm. (VehicleMRTX1133: n=4, MRTX1133: n=5, VehicleMRTX849: n=3, MRTX849: n=3). (H) Schematic of experiments with C57BL6/J mice orthotopically implanted with PKC-HY19636. Treatment started when tumors were 685 mm3 by MRI. (I) Survival of mice with PKC-HY19636 orthotopic tumors with the indicated treatment groups (Iso/veh (n=7), MRTX1133 (n=3), MRTX1133+αCD8 (n=6), MRTX1133+αCTLA-4 (n=5), MRTX1133+αCTLA-4+αPD-1 (n=9), MRTX1133+αCD19 (n=6)) (J) Tumor volumes at 1 week post treatment initiation in the indicated treatment groups by MRI (Iso/veh (n=5), MRTX1133 (n=6), MRTX1133+αCD8 (n=5), MRTX1133+αCTLA-4 (n=8), MRTX1133+αCTLA-4+αPD-1 (n=10)). (K) Change in tumor volumes of indicated groups compared to baseline by MRI (Iso/veh (n=5), MRTX1133 (n=6), MRTX1133+αCD8 (n=5), MRTX1133+αCTLA-4 (n=8), MRTX1133+αCTLA-4+αPD-1 (n=10)). (L) Representative MRI of tumor burden 1 week post treatment initiation. (M) Representative H&E of the pancreas in the indicated group and (N) associated histopathological scoring (Iso/veh (n=5), MRTX1133 (n=3), MRTX1133 + αCD8 (n=3), MRTX1133 + αCTLA-4 (n=3), MRTX1133+ αCTLA-4 + αPD-1(n=3)). Scale bar: 100 μm. Data are presented as mean + SD in A, G, J, K and N; as mean in C and D, and as violin plots in E. In A, Mann-Whitney test was used for CD4+ T cells comparisons, comparisons between VehicleMRTX1133 and MRTX1133 for CD3+ T cells, and comparisons between VehicleMRTX849 and MRTX849 for CD19+ cells. Unpaired t-test was used for all other comparisons in A. In G, Mann-Whitney test was used for the comparisons between VehicleMRTX1133 and MRTX1133 and unpaired t-test was used for all other comparisons. In J and K, Brown-Forsythe ANOVA with Dunnett’s T3 multiple comparisons test was used to determine significance. In N, two-way ANOVA with Dunnett’s multiple comparisons test was used to determine significance. In I, log rank test was used to determine significance. * P<0.05, ** P<0.01, *** P<0.001, **** P<0.0001, ns: not significant.
See also Figures S7–S9.

