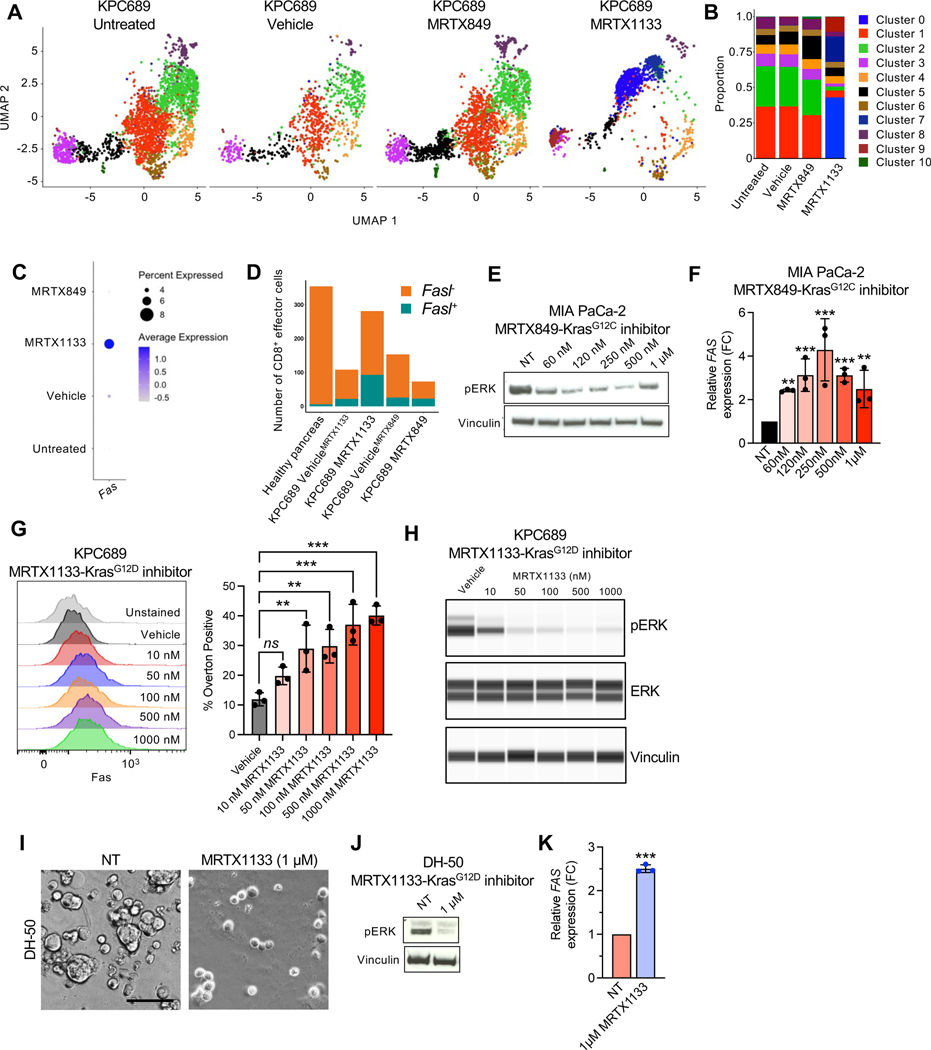
Figure 6: KRAS* inhibition induces FAS expression in cancer cells.
(A) UMAP projections and relative proportions of each cluster (B) of KPC689 cells evaluated by scRNA-seq analysis. (C) Expression of Fas in KPC689 cells evaluated by scRNA-seq analysis. (D) Number of CD8+ effector cells with Fasl (Fasl+) or without Fasl (Fasl−) expression in KPC689 tumors in C57BL6/J mice evaluated by scRNA-seq analysis. (E) Western blot analysis of pERK expression level in MIA PaCa-2 cells treated with KRASG12C inhibitor (MRTX849). (F) qPCR analysis of relative FAS expression in MIA PaCa-2 cells treated with KRASG12D inhibitor (MRTX1133) (n=3 biological replicates per group). (G) Representative flow plots and quantification of FAS expression at 24 hours post-treatment with vehicle (DMSO) or the indicated concentrations of MRTX1133 in KPC689 cells. n=3 biological replicates per group. (H) pERK and total ERK in KPC689 at 24 hours post-treatment with vehicle (DMSO) or the indicated concentrations of MRTX1133. (I) DH-50 organoids were treated with KRASG12D inhibitor (MRTX1133) (n=3 biological replicates per group). Representative phase-contrast microscope image. Scale bar, 50 μm. (J) Western blot analysis of pERK expression in DH-50 organoids treated with KRASG12D inhibitor (MTX1133). (K) qPCR analysis of relative FAS expression in DH-50 organoids treated with KRASG12D inhibitor (MRTX1133) (n=3 biological replicates per group). Data are presented as mean + SD in F, G, and K. Significance was determined by one-way ANOVA with Dunnett’s multiple comparisons test in F and G and by unpaired t-test in K. *P<0.05, **P<0.01, ***P<0.001, ****P<0.0001, ns: not significant.
See also Figure S10.

