
Figure 3.
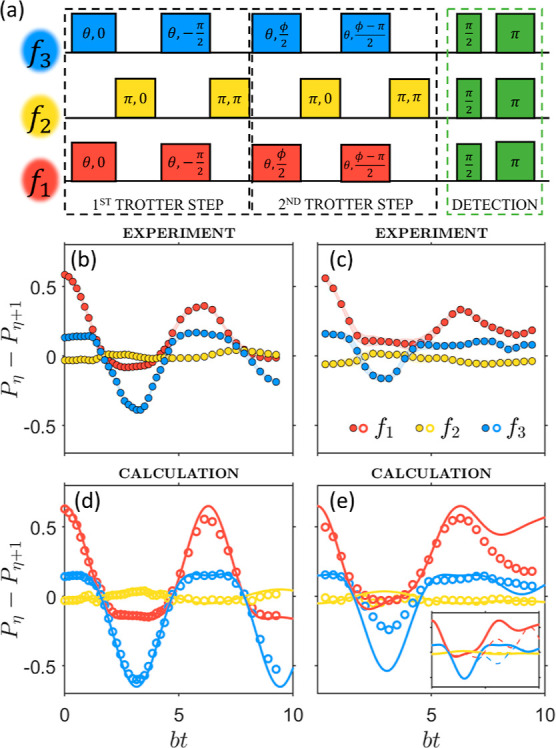
Simulation of the transverse Ising model. (a) 3-Frequency pulse sequence to implement the quantum simulation of the transverse-field Ising model on 4 levels of the hardware qudit and to detect the final output. (b,c) Difference of populations between neighboring levels, measured at B0 = 0.22 T and T = 1.4 K by echo-sequences at the three driving frequencies f1 (red), f2 (yellow), and f3 (blue) for the non-interacting (b) and interacting (c) cases. The shaded areas represent the estimated experimental uncertainties in the amplitude determination. (d,e) Corresponding calculations for n = 2 with the inclusion of the incoherent Lindblad dynamics induced by the measured single-, double-, and triple-quantum coherence times. Inset of panel (e): results for n = 2 Suzuki–Trotter decomposition compared with the exact evolution induced by the target Hamiltonian (dashed lines).