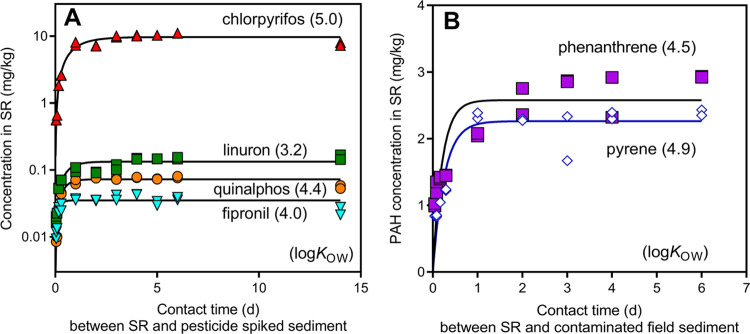
Figure 2.
Pesticide (A) and PAH (B) concentrations in silicone rubbers (SR) (n = 2) after different contact times (days) with (A) sediment spiked with different pesticides and (B) contaminated field sediments. The log KOW is given in parentheses for each chemical. The fitted lines represent a first-order exponential uptake curve. Note that panel (A) has a logarithmic Y axis.

