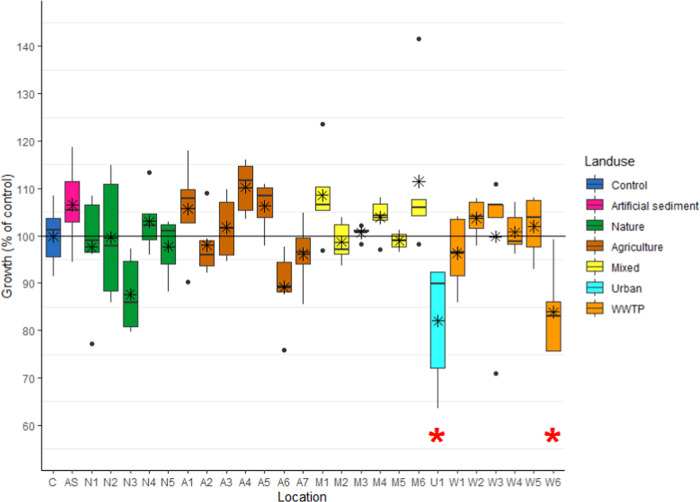
Figure 5.
Growth of C. riparius larvae (% of control, n = 5) after 96 h of exposure to medium dosed by SR (n = 5) equilibrated with sediment originating from different locations (n = 25). Colors indicate land use: C = control, AS = artificial sediment, N = nature, A = agriculture, M = mixed, U = urban, and W = WWTP. The black line represents the average control growth, the black lines within the boxes represent the median growth per location, the black asterix within the boxes represents the mean growth per location, dots indicate outliers, a red asterix indicates significant (p < 0.05) differences in growth compared to the control.

