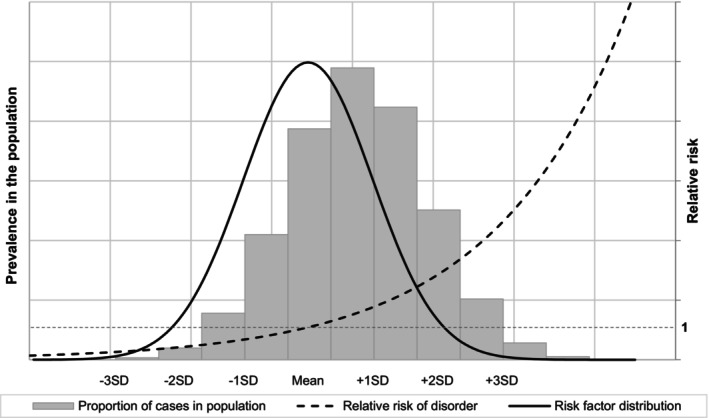
Figure 1.

Hypothetical relationship between a normally distributed risk factor, relative risk of mental disorder and the proportion of cases in the general population. A risk factor for mental disorder is normally distributed in the population with a hypothetical mean and standard deviation, SD (bell curve indicated by solid black line). That risk factor is associated with a hypothetical relative risk of mental disorder, indicated by the dashed black exponential curve. For convenience, we set the relative risk to be 1 (grey dashed horizontal line) at the mean level of exposure to that risk factor. The hypothetical proportion of cases that arise in the population are indicated by the grey bars. Under these assumptions, most cases of disorder in the population will occur for those only exposed to moderate levels of the risk factor (from the mean to +2 SD above the mean). Fewer cases will be generated by the small proportion of the population beyond +3 SD above the mean, even though they are at substantially greater relative risk. Thus, following G. Rose's argument 309 , more cases of disorder in a population may be prevented by intervening at lower levels of exposure in the general population than by targeting high‐risk groups. This hypothetical argument has been confirmed in psychiatry (see, for example, Polek et al 315 ).
