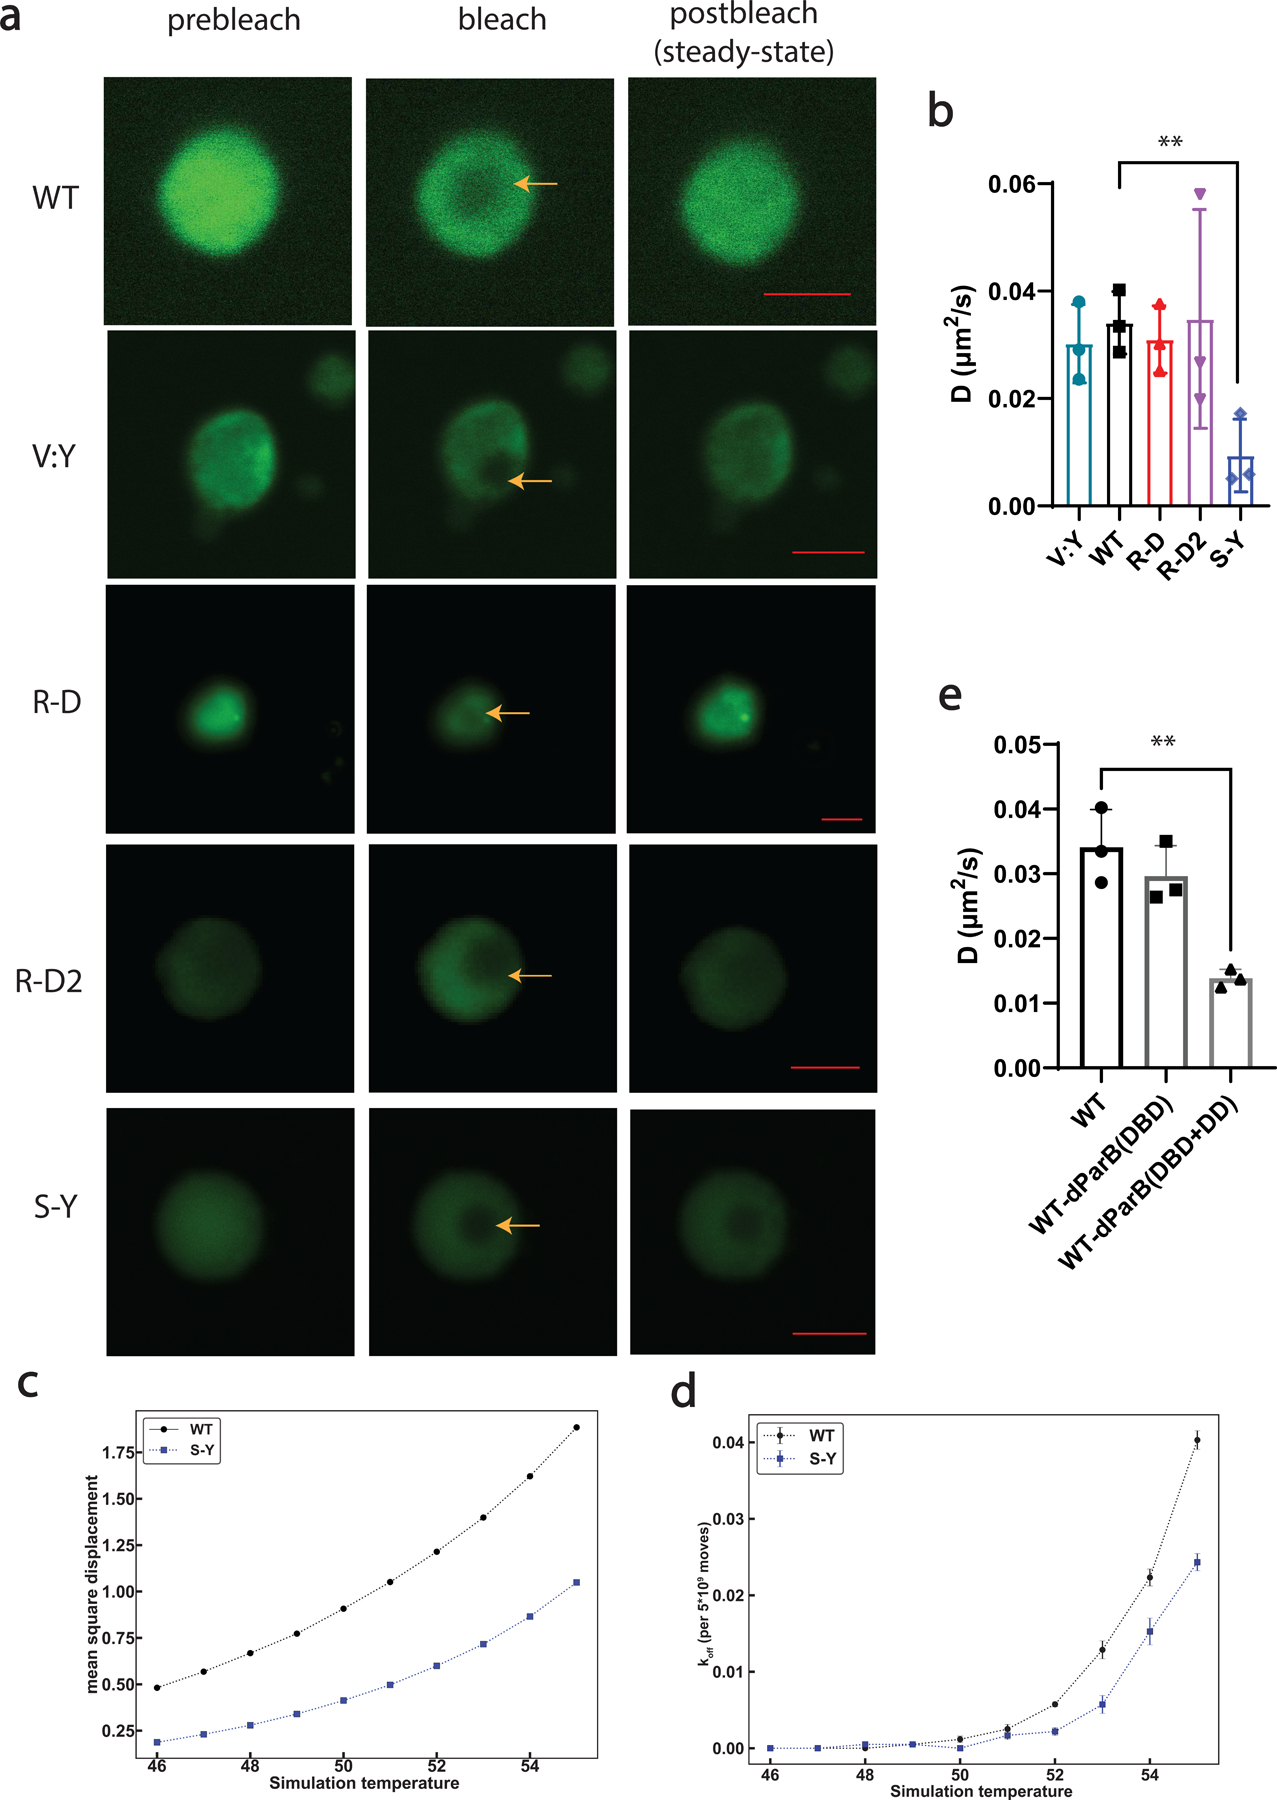
Extended Data Fig 4. FRAP and computational analysis of condensates formed by synIDPs.

Proteins was prepared at 50 µM (in buffer containing 50 mM Tris, 125 mM NaCl, pH 7.2) to ensure all the samples have visible condensates.
a, FRAP images and recovery curves of condensates formed by different types of synIDPs (doped with 10% of sfGFP labeled IDPs). Scale bar is 5 μm.
b, Comparison of derived apparent diffusion coefficients of condensates formed by different artificial IDPs based on recovery curve fitted by single exponential fitting equation and the corresponding bleaching area75.
c, Mean square displacement (MSD) values of chains in WT (black) or S-Y (blue) condensates. MSD values are in square lattice units per total system Monte Carlo moves. Standard errors from the mean across 5 independent simulations are smaller than the marker sizes.
d, Evaluation of the likelihood for a chain to exit the condensates after Monte Carlo moves by comparing the amounts of chain still in the condensates with the amounts of chain moving out of the condensates.
e, Comparison of derived apparent diffusion coefficients of condensates formed by different protein components. n = 3 independent experiments. Bar graph represents mean ± SD. *, p<0.025; **, p<0.006 by a two-tailed unpair t-test.
