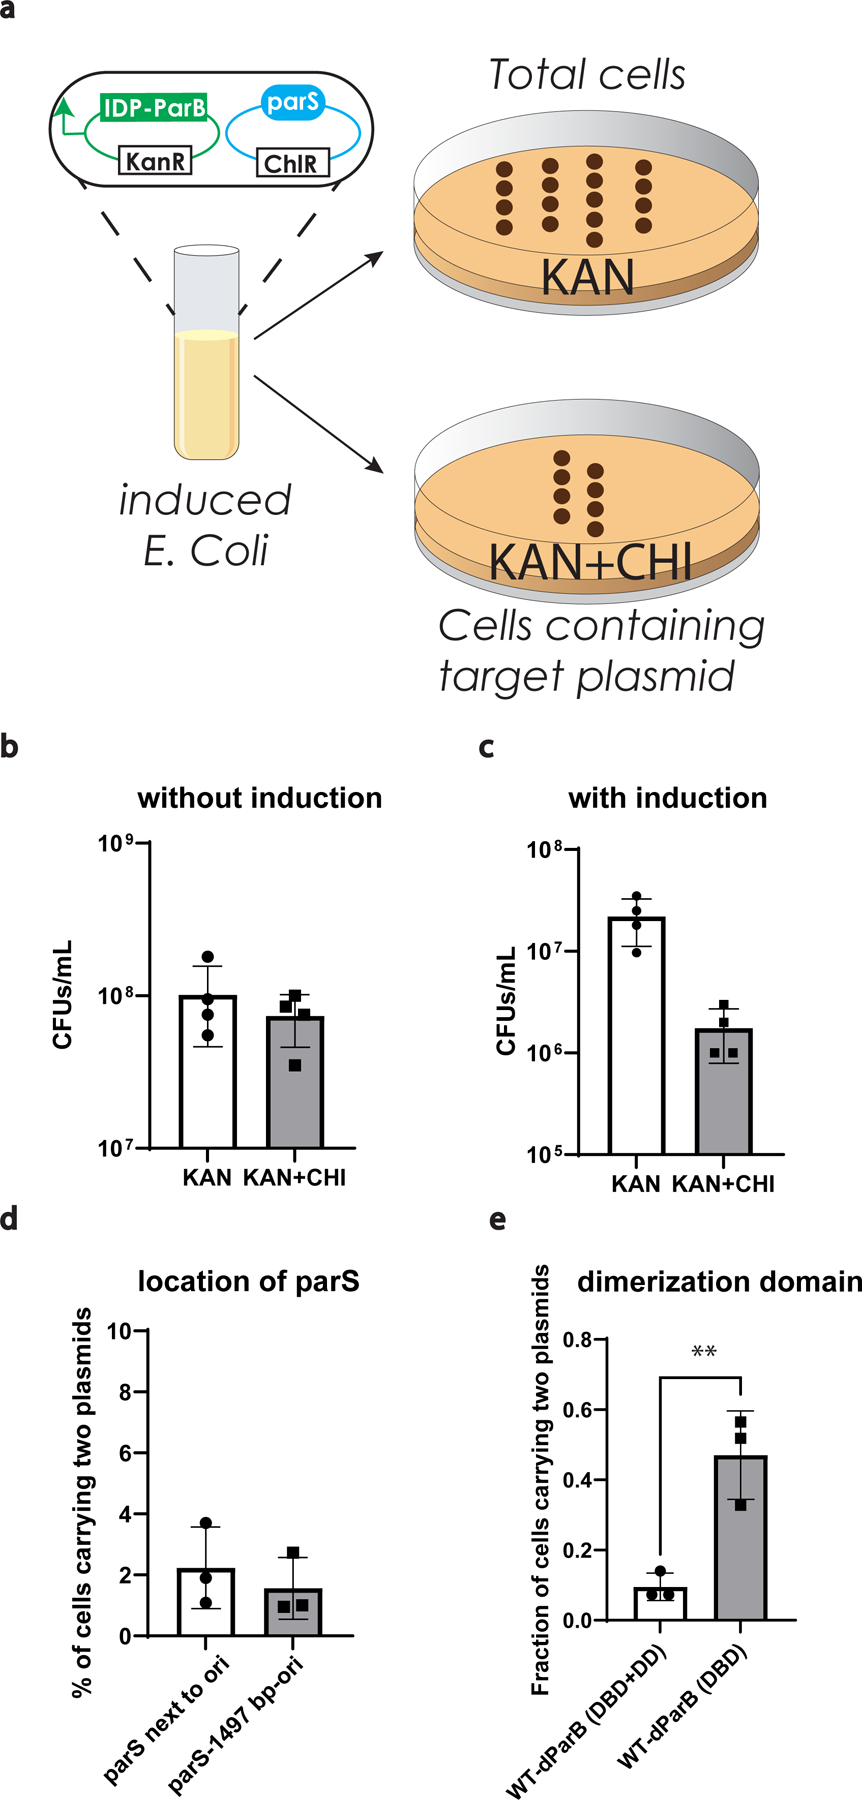
Extended Data Fig 6. Evaluation of condensate mediated plasmid partition.

a, Experimental procedure to measure plasmid loss.
b, c, Evaluation of change of total cell counts based on different testing conditions under the selection of kanamycin or kanamycin and chloramphenicol after 5 h of growth with/without induction. n=4 biologically independent samples. Bar graph represents mean ± SD.
d, Comparison of change of fraction of cells carrying both plasmids based on the location of the parS site after 5 h of induction with 0.5 mM IPTG. n=3 biologically independent samples. Bar graph represents mean ± SD.
e, Evaluation of the contribution of dimerization domain on modulating the fraction of cells carrying two plasmids after 90 min of induction with 0.5 mM IPTG. n=3 biologically independent samples. **, p=0.0079 by a two-tailed unpair t-test. Bar graph represents mean ± SD.
