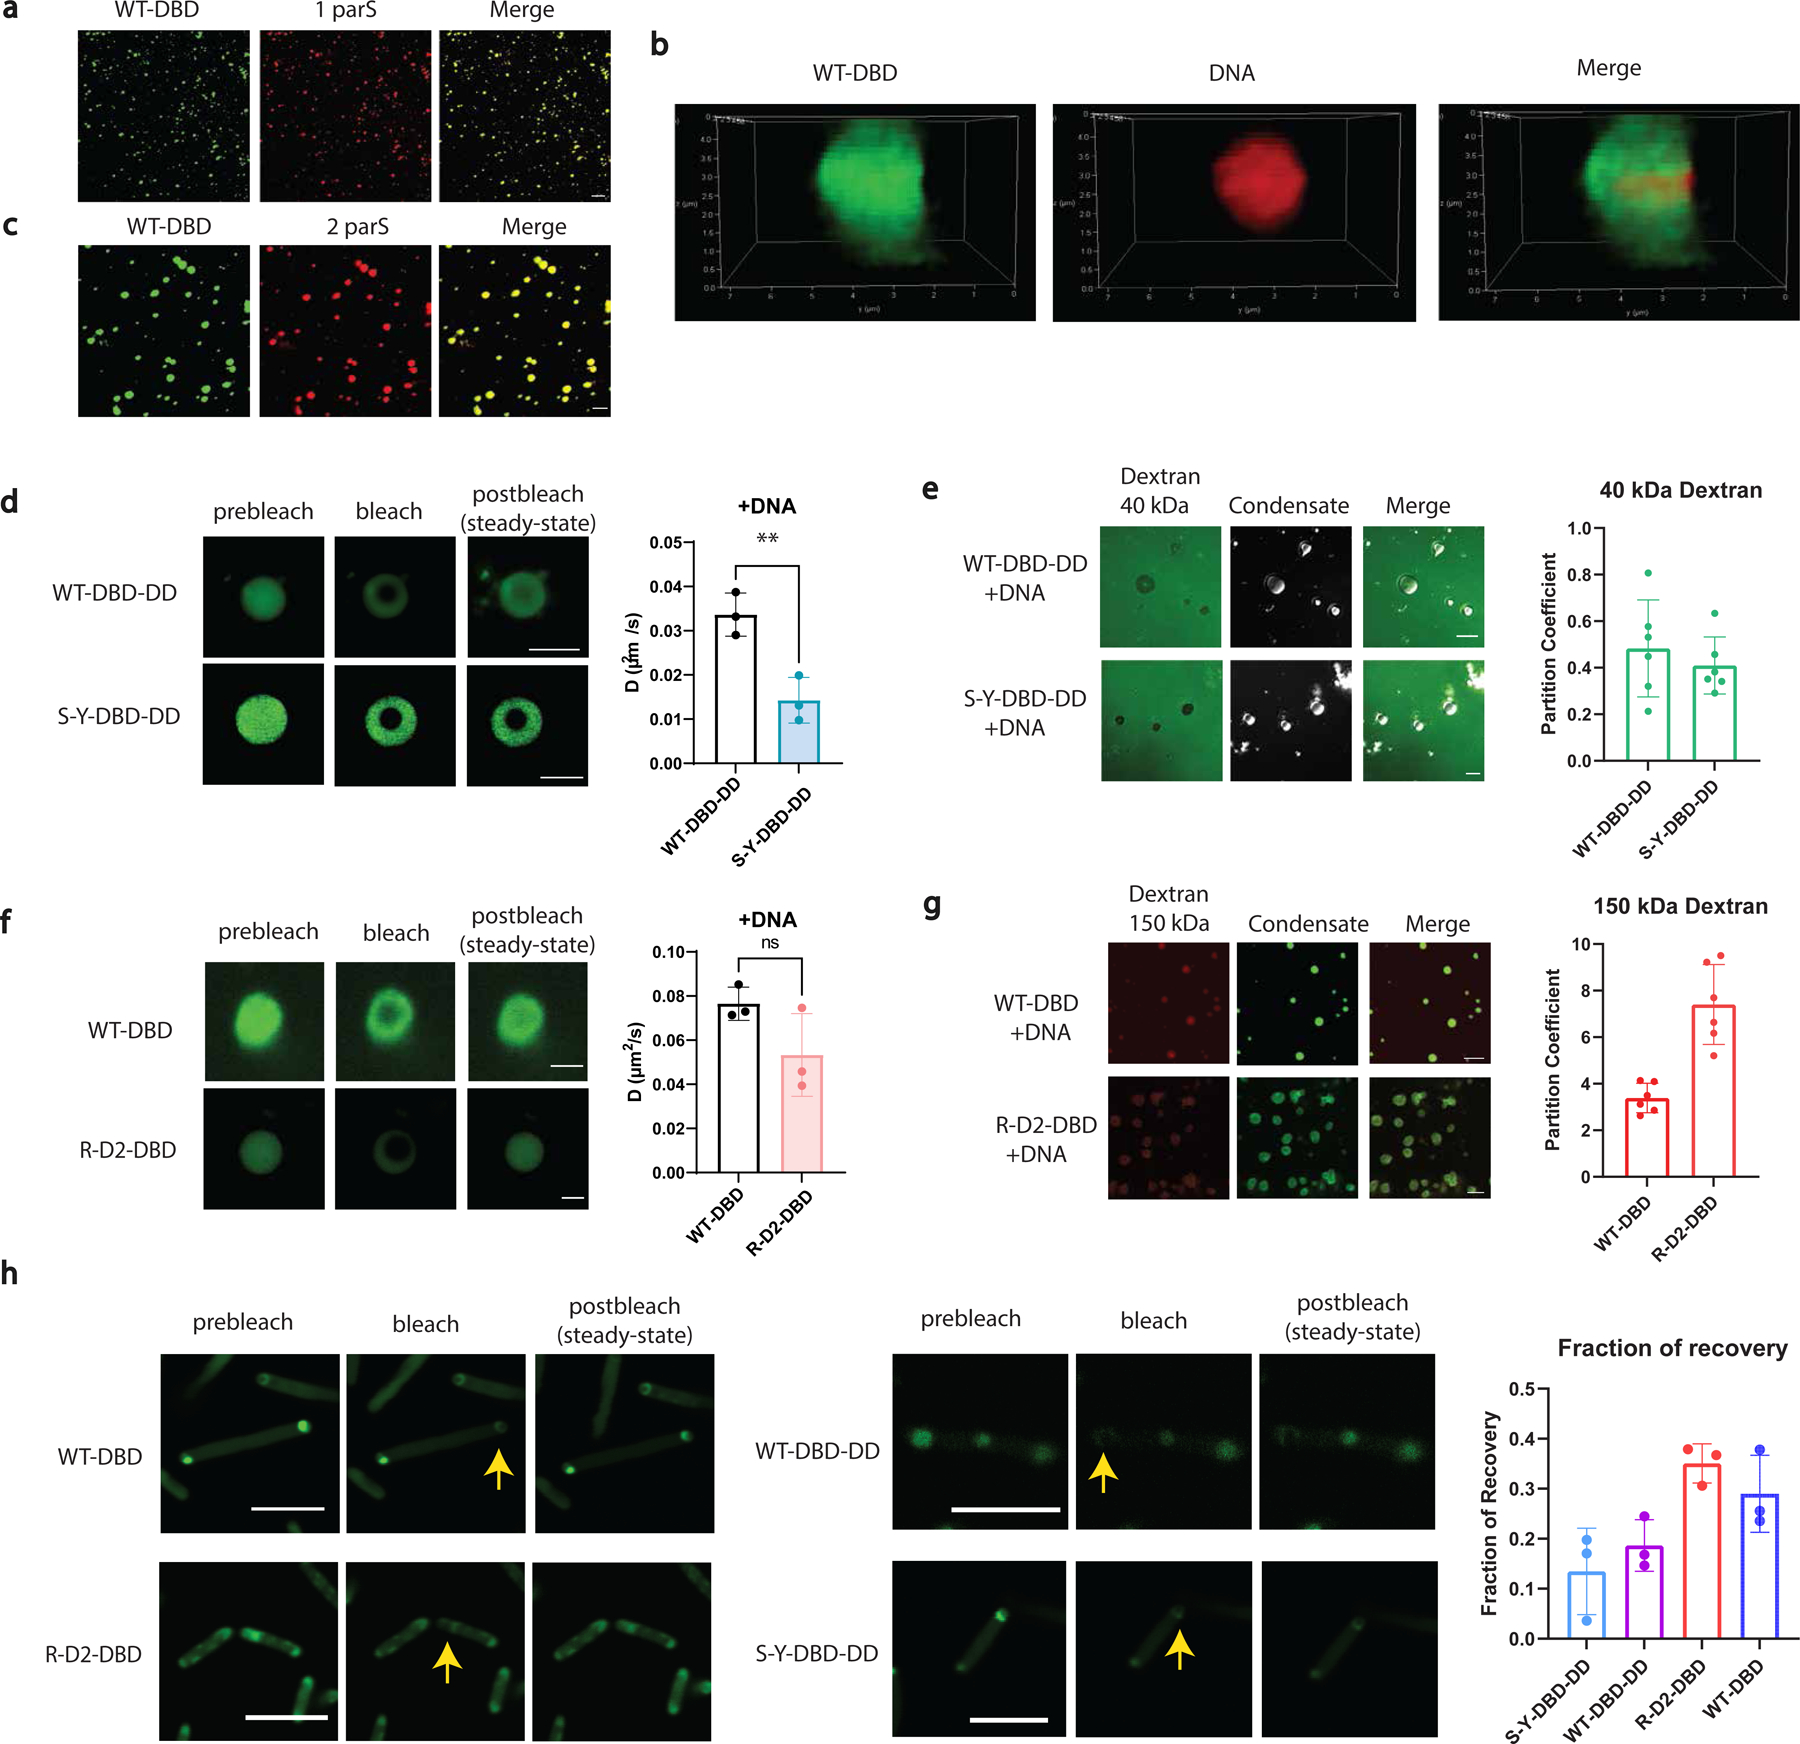
Fig. 3 |. Evaluations of the molecular dynamics and permeability of synthetic DNA condensates.

a, Condensates formed by 500 nM WT-dParB (DBD) (doped with 10% WT-DBD-sfGFP) with 10 nM DNA (cy3-labeled) containing 1 parS site. Scale bar is 10 µm. WT-DBD is labeled green (left panel). DNA is labeled red (middle panel).
b, Super-resolution images showing deconvoluted 3D construction of a single DNA condensate. WT-DBD is labeled green (left panel). DNA is labeled red (middle panel).
c, Condensates formed by 500 nM WT-DBD (doped with 10% RLPWT-DBD-sfGFP) with 10 nM Cy3-labeled DNA containing 2 parS site. Scale bar is 10 µm.
d, Representative FRAP images and derived diffusion coefficients of 500 nM synIDP-DBD-DD in the DNA condensates (doped with 10% synIDP-DBD-DD-sfGFP). Scale bar is 5 µm. n = 3 independent experiments. **, p=0.0092 by two-tailed unpaired t-test.
e, Permeability of the DNA condensates formed by RLPS-Y and RLPWT -DBD-DD-DNA to fluorescein labeled dextran 40 kDa. Both RLPS-Y and RLPWT mediated DNA condensate exclude 40 kDa dextran with a partition coefficient smaller than 1. Condensates are shown in the bright-field images in the middle. Scale bar is 10 µm. n = 6 independent experiments.
f, Representative FRAP images and derived diffusion coefficients of 500 nM synIDP-DBD in the DNA condensates (doped with 10% synIDP-DBD-sfGFP). Scale bar is 5 µm. ns, non-significant, p=0.1173 by two-tailed unpaired t-test. n = 3 independent experiments.
g, Permeability of the condensates formed by RLPWT and RLPR-D2-DBD with DNA to Antonia red labeled dextran 150 kDa. Both RLPWT and RLPRD2 mediated DNA condensates are permeable to 150 kDa dextran with a partition coefficient larger than 1. Condensates are shown in the green fluorescence channel in the middle. Scale bar is 10 µm. n = 6 independent experiments.
h, Representative FRAP images and fraction of recovery of different condensates in living cells.
Scale bar is 5 µm. n = 3 independent experiments.
Bar graph represents mean± SD
