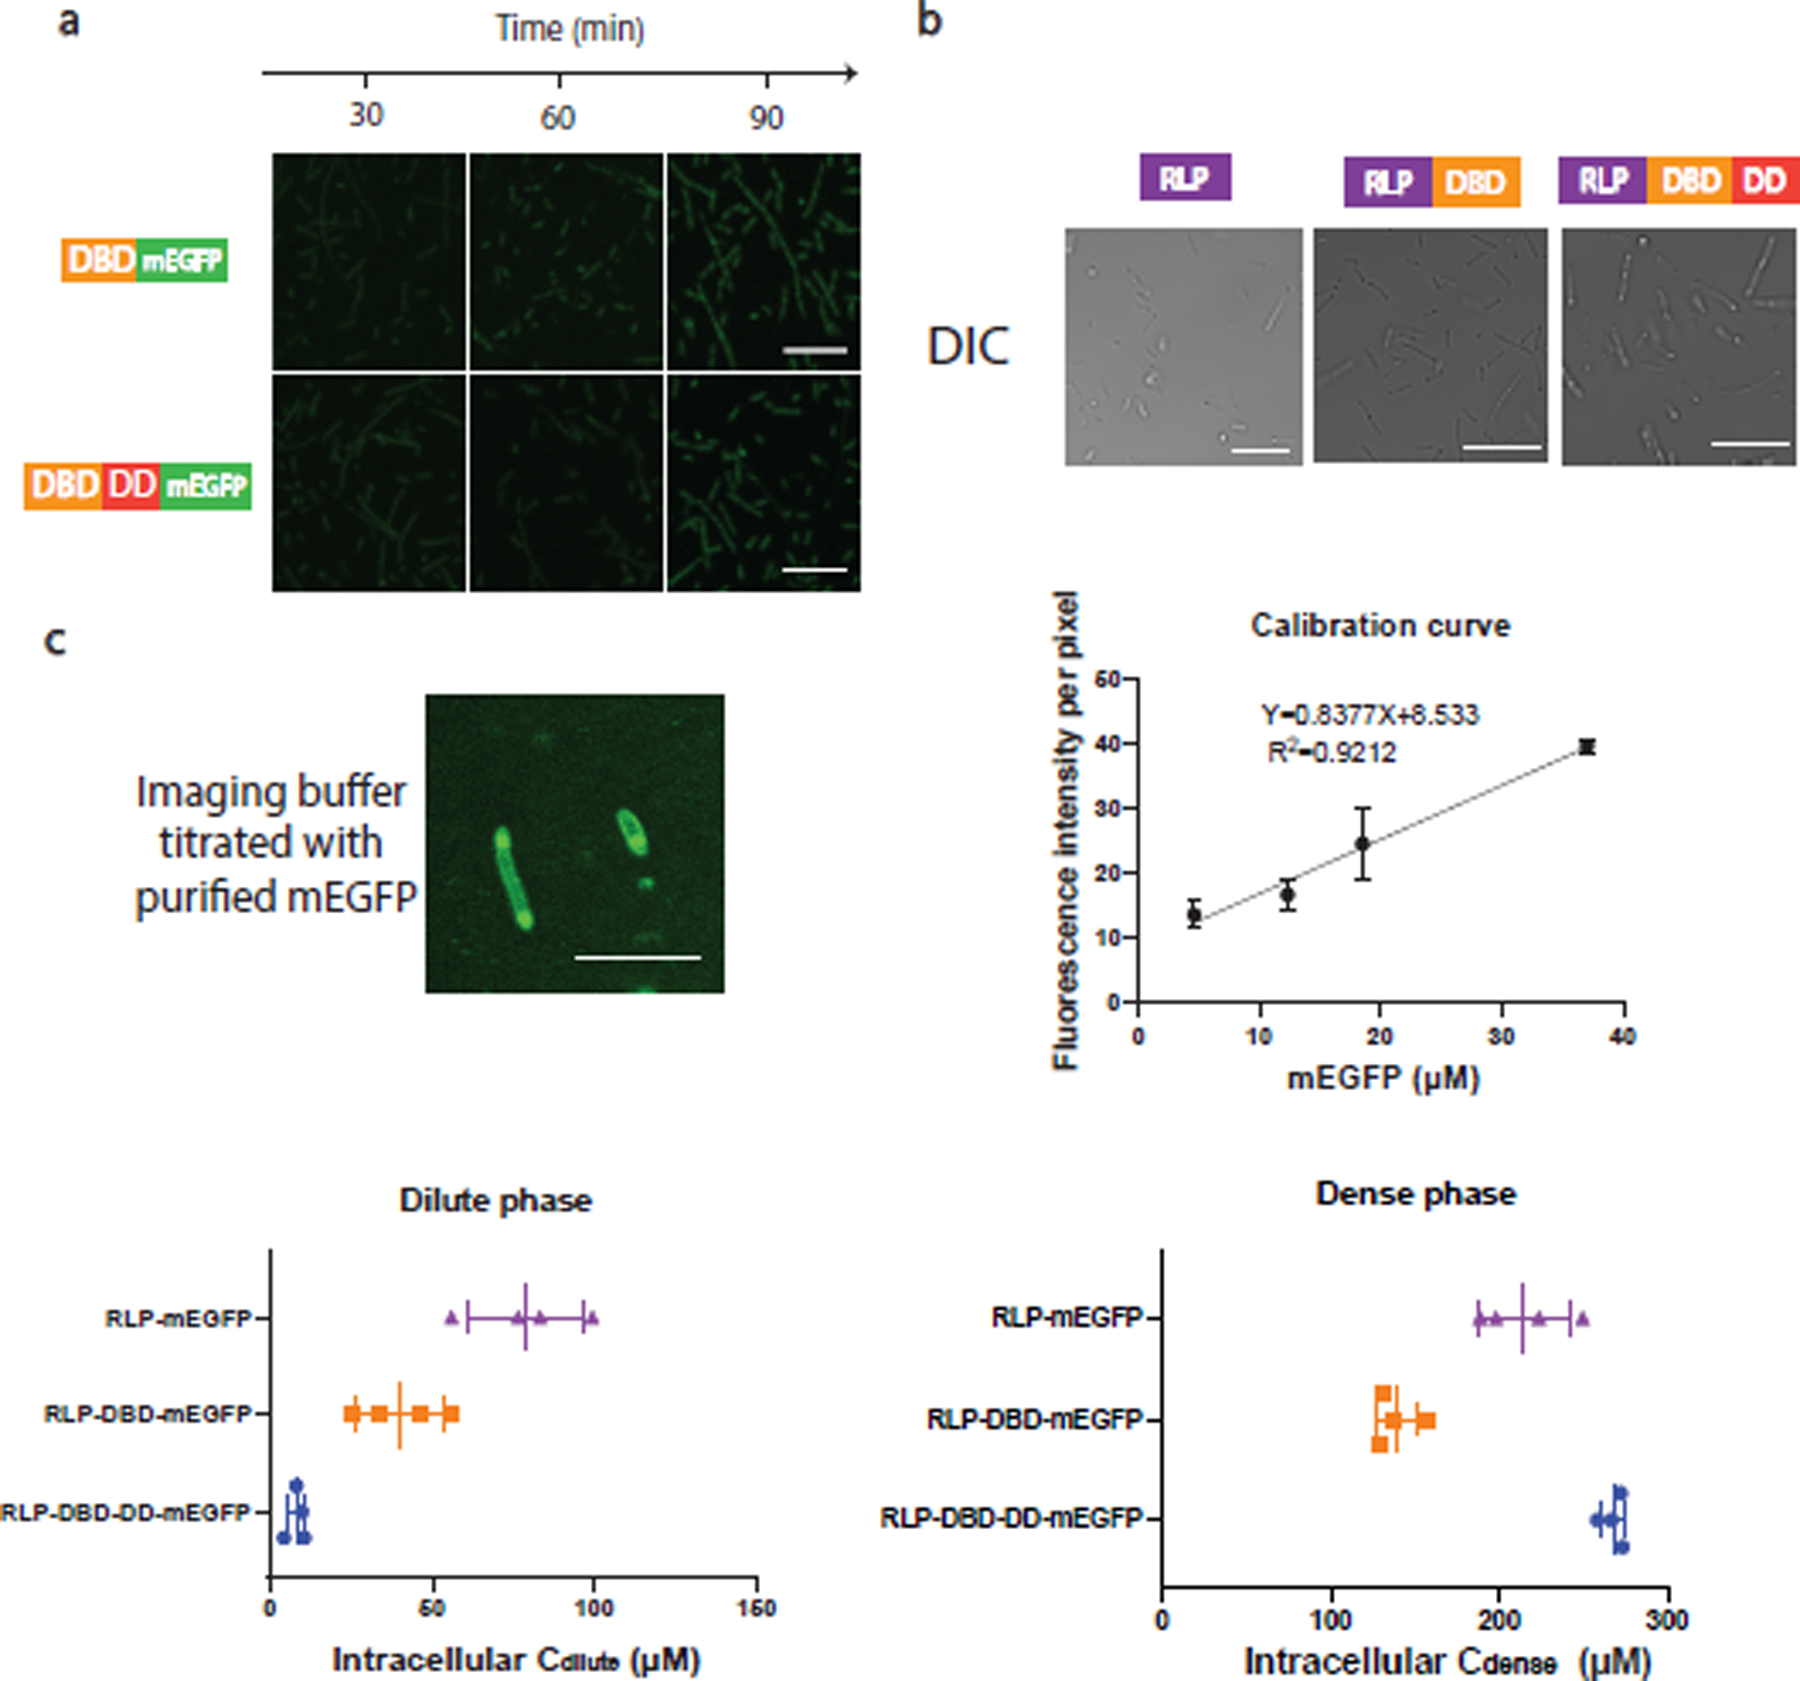
Extended Data Fig 1. Evaluation of the effects of protein domain on condensate formation in cell.

a, Confocal fluorescence images of cells containing dParB DNA binding domain (DBD) (126–254)-mEGFP fusion and dParB DNA binding domain and dimerization domain (DBD-DD) (126–304)-mEGFP fusion. Neither of the constructs were able to show distinct puncta in cell. n=3 independent biological repeats with similar results. Scale bar is 10 μm.
b, Confocal differential interference channel (DIC) images for the evaluations of condensate formation in cells containing constructs expressing RLPWT, RLPWT-DBD, RLPWT-DBD-DD after 1 h of induction. n=3 independent biological repeats with similar results.
c, Estimation of intracellular protein concentrations by purified mEGFP protein. To establish a calibration curve, different concentrations of purified mEGFP protein were titrated into the cellular sample as shown in the top left panel to obtain an accurate calibration at the imaging Z coordinate. Because of the significant difference between the dense phase and the dilute phase, to prevent oversaturation of fluorescence signal while capable of obtaining accurate fluorescence intensity measurement, the energy of the WLL laser, the percentage of the intensity of the excitation laser, the detector range and pin hole size were tuned to cover the fluorescence signal of the dense and the dilute phase. If the dense phase signal is oversaturated or the dilute phase signal is similar to the non-fluorescence background sample, then the tuning process would start again until the range is covered. The background fluorescence intensity per pixel was analyzed by LAS X built-in module. The fluorescence intensity corresponding to different concentrations of purified mEGFP was utilized to construct the calibration curve (top right panel), which is utilized to estimate the intracellular protein concentration. The estimated intracellular dilute and dense phase concentration are shown in the bottom panel. Scale bar is 2.5 μm. n = 4 biologically independent samples. Error bar represents standard deviation.
