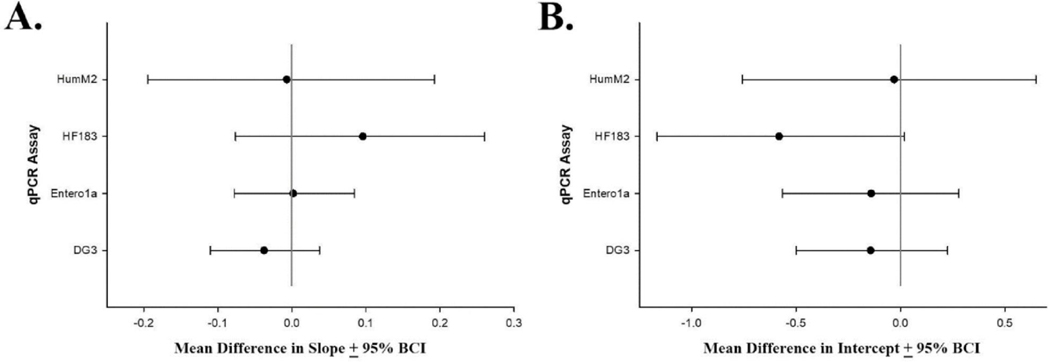
Fig. 2.
Scatter plots showing HF183/BacR287, HumM2, Entero1a, and DG3 qPCR assay mean difference (yeast carrier tRNA absent: yeast carrier tRNA present) for standard curve model slope (Panel A) and y-intercept (Panel B) with 95% Bayesian credible intervals (BCI). Shaded circles represent respective mean differences and error bars depict respective 95% BCI. The vertical line indicates a mean difference of zero. Calibration model parameter mean difference values where the 95% BCI intersects zero indicate no significant difference between the respective standard curve parameter with and without the yeast carrier tRNA stabilizer.

